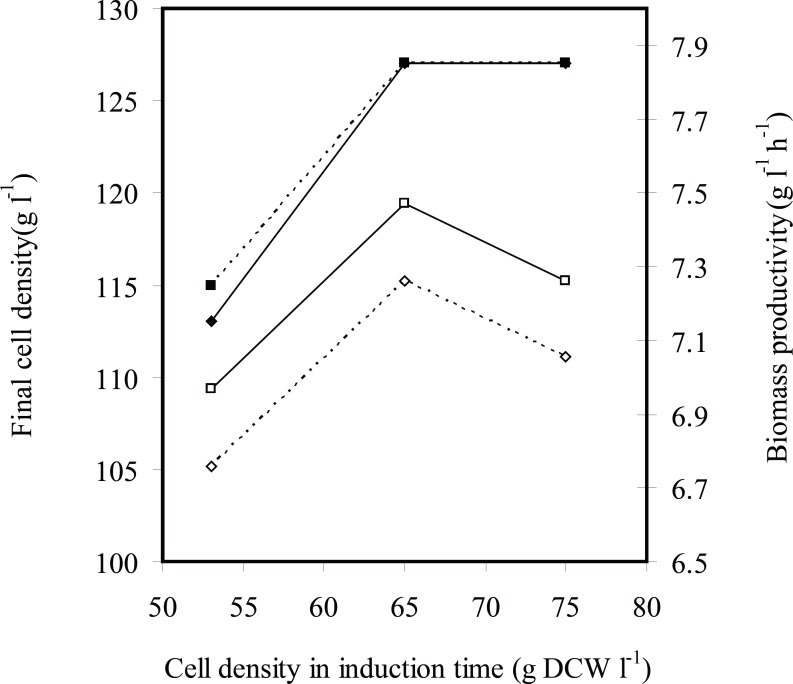
Figure 4.
The effects of induction time (cell density at induction time g L-1 DCW) on the final cell density (g L-1 DCW) (■) and biomass productivity (g L-1 h-1 DCW) (□) in fed-batch cultures of E.coli BL21 (DE3) (pET3a-ifnγ). The black and dotted lines denote inducer concentrations of 2.25×10⁻³ and 1.13×10⁻³ g L-1 g-1 IPTG per DCW, respectively

