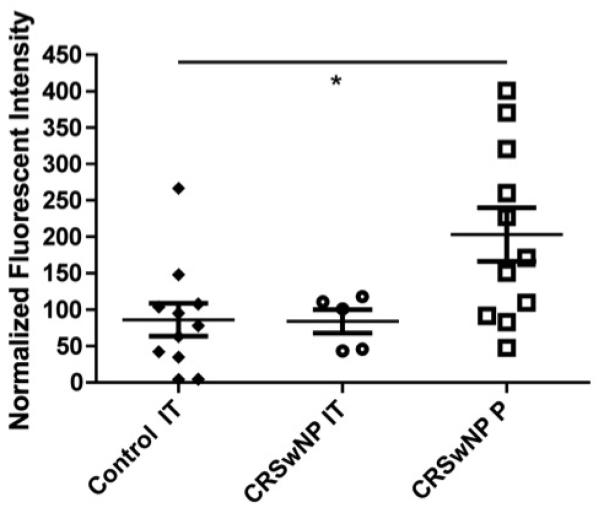
Figure 1.
Autoantibody microarray data demonstrating the fluorescent intensity of extracts from control inferior turbinate (IT) tissue, IT tissue from patients with CRSwNP and polyps (P) from patients with CRSwNP. Presented results are normalized to the fluorescent intensity of IgG.
IT = inferior turbinate; P = polyps; CRSsNP = chronic rhinosinusitis without nasal polyps; CRSwNP = chronic rhinosinusitis with nasal polyps

