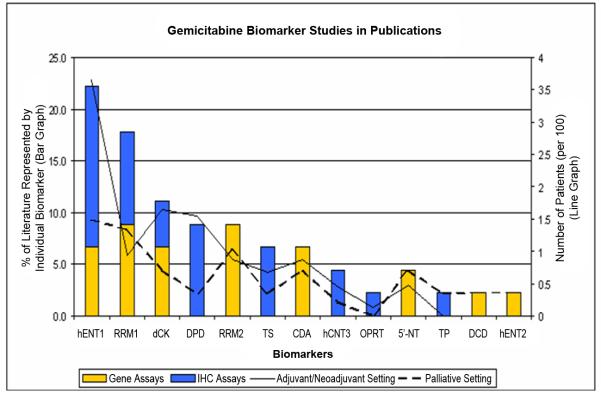
Figure 2. Publication trend for biomarker studies that examined the expression of molecular markers involved in gemcitabine metabolism.
Publication summary of gemcitabine metabolism biomarker studies. Bar graph represents the percent distribution of each biomarker examined & reported on survival in these 21 studies. Stacked color bars represent the distribution of the index assays employed (BLUE bar: immunohistochemistry; YELLOW bar: gene-expression quantitative assay). Line graph represents the total number of patients samples (per 100) evaluated for each biomarker (solid line: adjuvant and neoadjuvant settings combined; dashed line: palliative setting).

