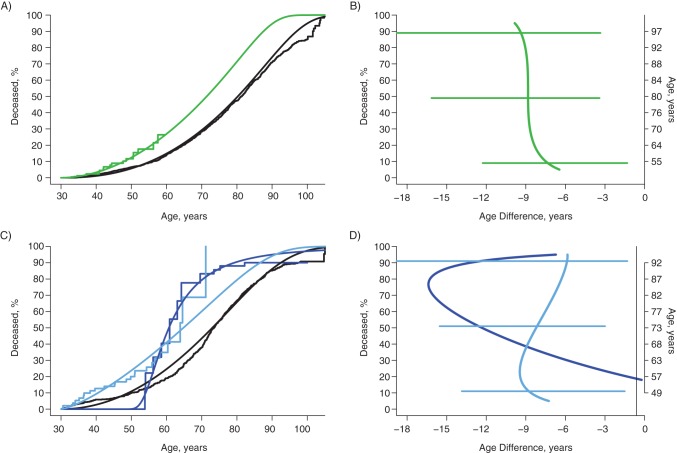
Figure 3.
Survival curves and estimates of years of life lost due to drug use disorder and obsessive-compulsive disorder in black women and men in 4 sites of the Epidemiologic Catchment Area Study, 1979–1983 through 2007. Kaplan-Meier and generalized gamma survival curves for black women and men, showing the estimated effects of drug use disorder in black women and the combination of drug use disorder and obsessive-compulsive disorder in black men. B and D show the years of life lost compared with individuals in the general population who do not have a history of the disorders (age at death in those without disorders displayed on right-hand axes), with the 95% confidence intervals from bootstrapping procedures represented by horizontal bars. The confidence intervals for the 28 individuals with no drug use disorder or obsessive-compulsive disorder (D) were so large as to be uninformative and are not shown. For women (A and B), black lines denote no drug use disorder (825 of 2,553) and green lines denote drug use disorder (16 of 93). For men (C and D), black lines denote no obsessive-compulsive disorder and no drug use disorder (522 of 1,268), dark blue lines denote obsessive-compulsive disorder and no drug use disorder (11 of 28), and light blue lines denote drug use disorder (23 of 77).

