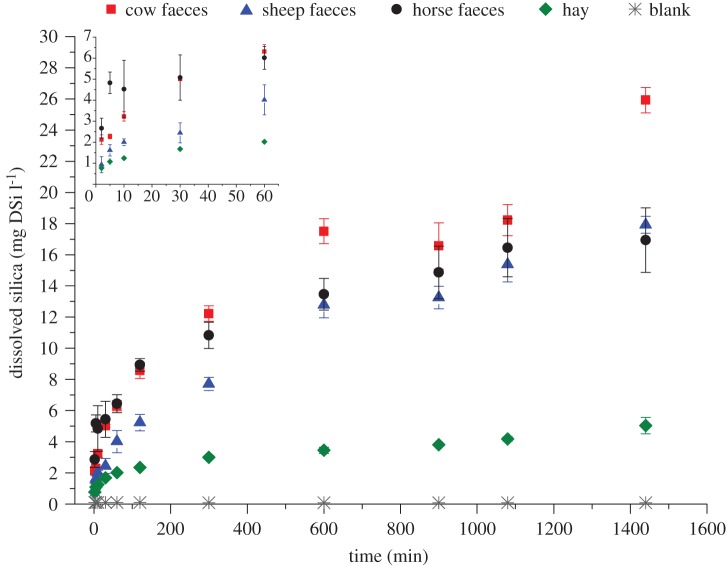
Figure 1.
Dissolution of BSi in grass and faeces after exposure to rain water. Results, expressed as mg DSi l−1, are plotted as mean values (symbols) and standard deviations (bars; n = 5) for different series (cow faeces, sheep faeces, horse faeces and hay) during 24 h (1440 min). Blank rain water samples were also incubated and sampled per time step (n = 1). The first 60 min of the dissolution experiment are visualized in detail in a smaller inset graph.

