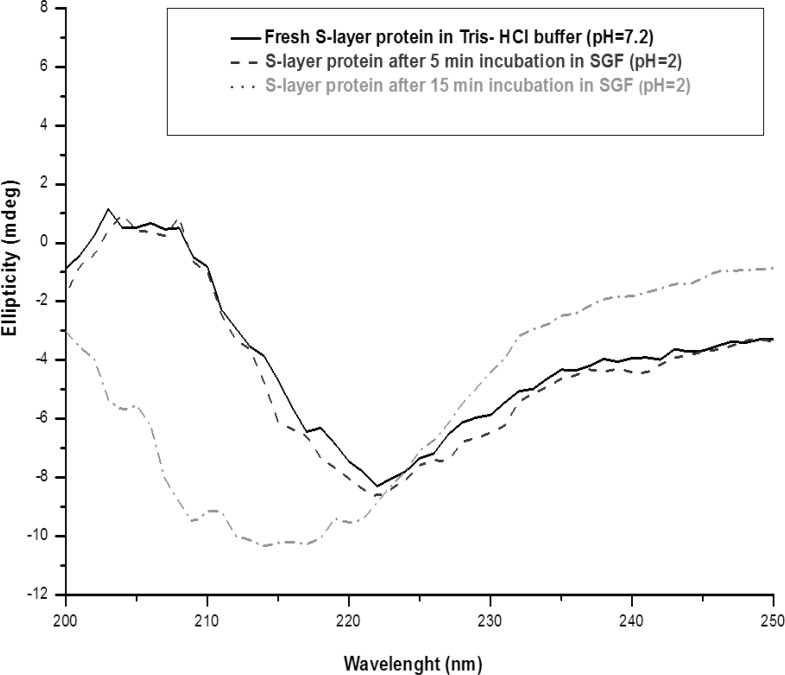
Figure 3.
Far-UV CD spectra of S-layer protein of L.acidophillusATCC4356 at 25°C: Fresh S-layer protein in Tris buffer (solid line), S-layer protein after 5 min incubation in SGF (pH = 2) (dash line) and S-layer protein after 15 min incubation in SGF (pH = 2) (dot line). Each spectrum represents the average of five scans.

