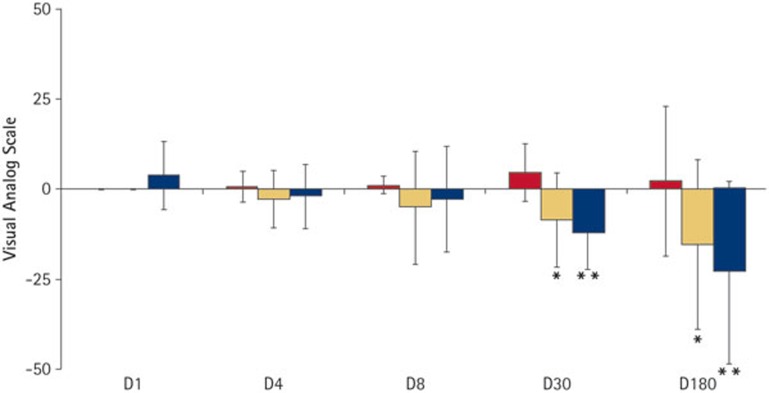
Figure 5. Effect of a single application of P11−4 on colour, size and progression of the treated caries lesion compared to baseline (D0) as judged by blinded assessors using a visual analogue scale from −100 to +100.
Histograms show change in lesion colour (red); change in lesion size (yellow) and change in lesion progression (blue). Lesion colour: positive values indicate an improvement in lesion colour (ie less white). Lesion size: positive values indicate a lesion that is increasing in size; negative values a decrease in lesion size. Lesion progression: positive values indicate a lesion that is judged to be progressing, negative values indicate a lesion that is judged to be remineralising. Significance when compared with baseline indicated by *(p ≤0.05); **(p ≤0.001)

