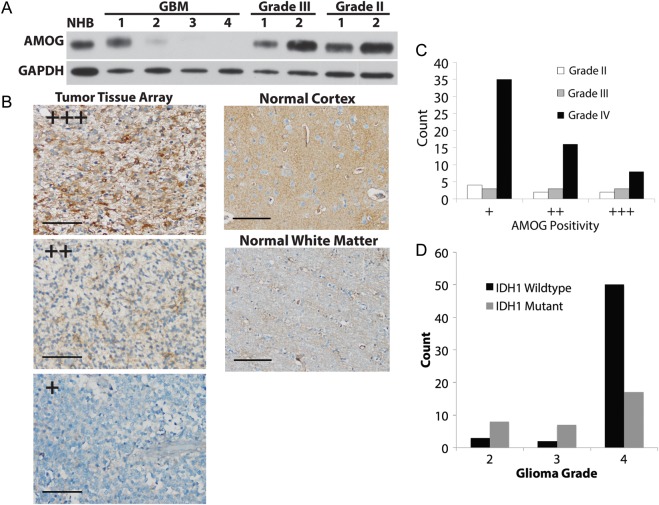
Fig. 1.
AMOG expression is variably downregulated in gliomas. (A) Immunoblotting evaluation of AMOG expression in 4 GBM samples, 2 WHO grade III anaplastic astrocytomas, 2 WHO grade II gliomas, and normal human brain cortex (NHB). Glyceraldehyde 3-phosphate dehydrogenase (GAPDH) was used as a loading control. (B) Immunohistochemical evaluation of AMOG expression in different grades of gliomas (astrocytomas) in tissue arrays containing 59 GBM samples, 9 grade III anaplastic astrocytomas, and 8 grade II astrocytomas. NHB was used as a positive control, and white matter was used as a negative control (shown in right column). AMOG positivity is defined by categorizing the percentage of tumor cells that stain positive for AMOG into 3 categories (representative pictures in the left column): + for 0%–25%, ++ for 26%–75%, and +++ for 76%–100%. Scale bar: 100 μm. (C) Quantification of AMOG positivity in glioma tissue array samples in part B. The bars represent the number of tumor samples that fall into each staining category for each tumor grade. (D) Quantification of IDH1 wild types and mutants in the glioma tissue array. As expected, more IDH1 mutants were found in grades II and III, while more IDH1 wild types were in grade IV.

