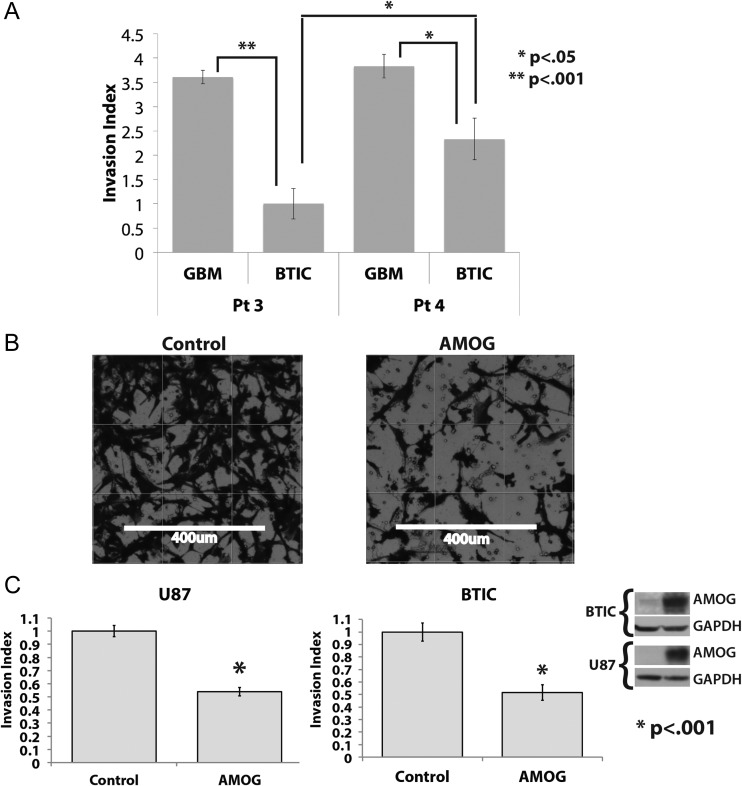
Fig. 3.
Overexpression of AMOG decreases GBM invasion. (A) The invasion of patient-matched BTIC and differentiated cells from patients 3 and 4 was assessed by seeding the same number of cells onto the Matrigel insert and allowing them to migrate toward 10% FBS in the bottom well. The bar graphs show each cell line's invasion index, which is calculated by normalizing the number of cells that invaded through the Matrigel in each cell line to that of the least invasive cell line. The least invasive cell line has an invasion index of 1 (*P < .05, **P < .001). (B) GBM cells were transfected with either a control vector or an AMOG overexpression vector; after 48 h, equal numbers of cells from both conditions were seeded onto the Matrigel insert and allowed to migrate toward the bottom well containing 10% FBS in media. Shown are representative pictures of control cells and AMOG-overexpressing cells from the same cell line. (C) The invasion index of the control and AMOG-overexpressing cells from the U87 cell line and a low AMOG-expressing BTIC culture. The invasion index was normalized to each cell line's control so that the baseline invasion of each cell line has an invasion index of 1 (*P < .001). GAPDH, glyceraldehyde 3-phosphate dehydrogenase. Insert: The overexpression of AMOG was confirmed by immunoblotting.

