Fig. 1.
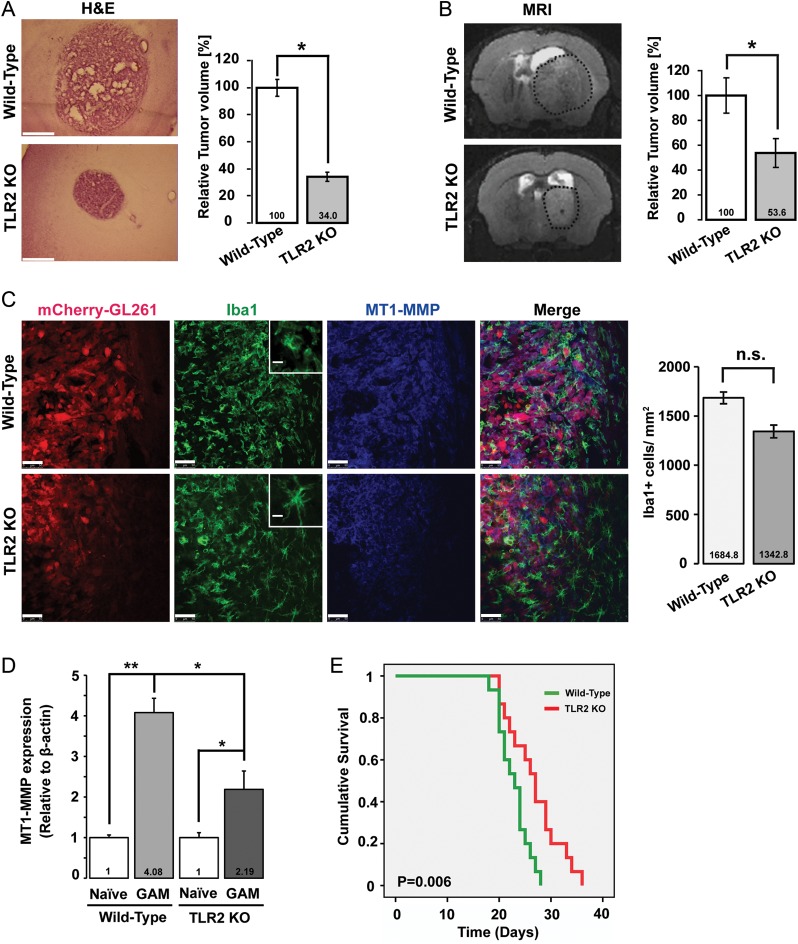
Absence of TLR2 results in reduced tumor expansion, decrease in MT1-MMP expression, and increased survival. (A) Deletion of the TLR2 gene locus impacts tumor expansion in vivo. Mouse GL261 cells were i.c. implanted into WT and TLR2 KO mice. The images on the left show H&E stained slices from glioma-bearing WT and TLR2 KO mice. On the right, the relative tumor volume in WT versus TLR2 KO animals was evaluated based on unbiased stereology. Scale bar is 500 μm . (B) A representative MRI T2-weighted image of a hyperintense tumor (delineated by dotted black circle) from WT and TLR2 KO mice. The relative tumor volume in WT and TLR2 KO mice is shown on the right. Statistical significance was analyzed by Wilcoxon's rank-sum test and significance was taken at P < .05(*) and P < .01(**). The significance is indicated in the bars. (C) Slices from glioma inoculated WT and TLR2 KO mice were immunohistologically labeled. Glioma cells were identified by stable expression of mCherry, microglia/brain macrophages by the expression of Iba1, and MT1-MMP by immunolabeling. The insets illustrate the morphology of GAMs in WT and TLR2 KO mice. While WT GAMs had ameboid morphology, GAMs in the TLR2 KO mouse were more ramified. Scale bars are 50 μm and 10 μm (for insets). The GAM cell density near the invasive edge of glioma is shown in the graph on the right. (D) WT and TLR2 KO mice were i.c. implanted with glioma tumors, and GAMs were isolated 14 days after glioma cell injection. Naïve tumor-free brain was used as a control. Data were collected from 3 different mice in each group. Differences in MT1-MMP gene expression were analyzed by 2(−ΔΔCT) method. MT1-MMP gene expression in WT GAMs is 4.08-fold upregulated (±0.204, P = .002) compared with WT naïve microglia, while in TLR2 KO GAMs, MT1-MMP gene expression was 2.19-fold upregulated (±0.26, P = .02). MT1-MMP gene expression in TLR2 KO GAMs is significantly decreased compared with WT GAMs (P = .045). Statistical significance was analyzed by Student's t-test and significance was taken at P < .05(*) and P < .01(**). (E) The Kaplan–Meier curves represent the cumulative survival of WT and TLR2 KO mice after glioma cell injection (P = .006).

