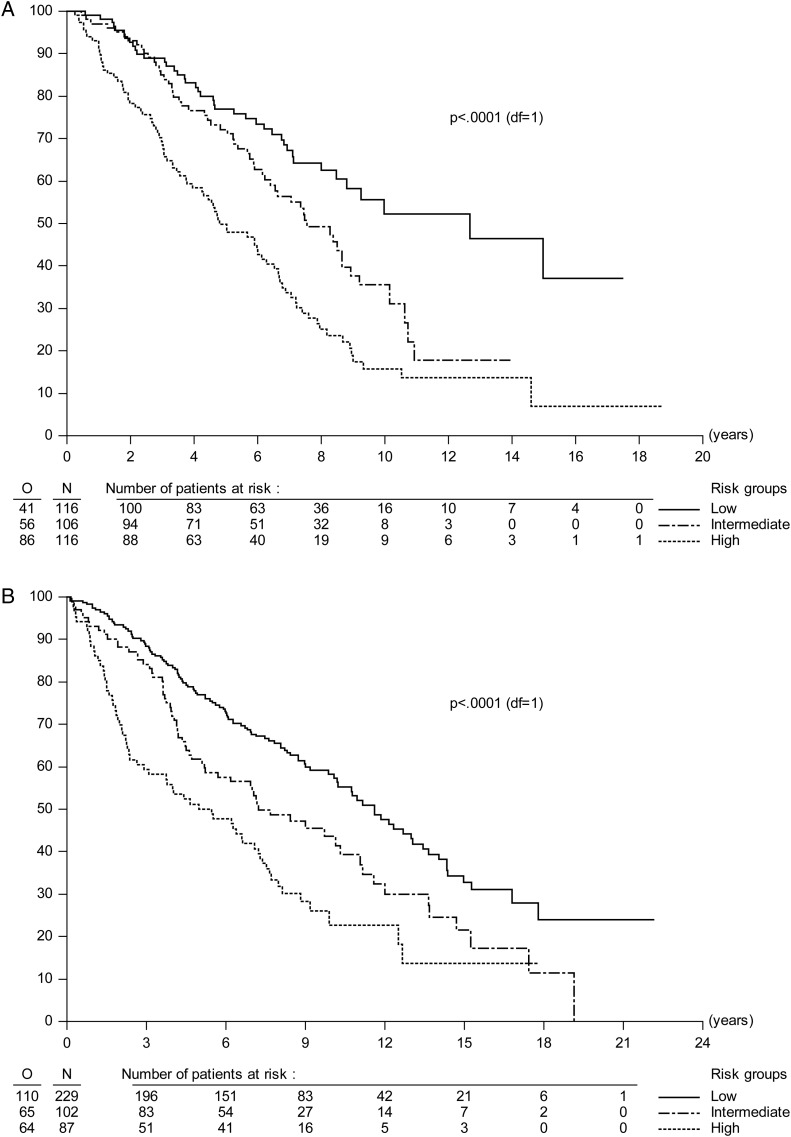
Fig. 2.
(A) OS curves split by prognostic risk group in the EORTC dataset. Compared with low-risk patients, patients with intermediate risk had OS HR = 1.67 with 95% CI = 1.12–2.51 and patients with high risk had OS HR = 2.90 with 95% CI = 2.00–4.22. (B) OS curves split by prognostic risk group in the NCCTG/RTOG dataset. OS HRs and 95% CIs were 1.58 and 1.16–2.14, P = 0.004, for intermediate risk patients and 2.47 and 1.81–3.38, P < .0001, for high-risk compared with low-risk patients.

