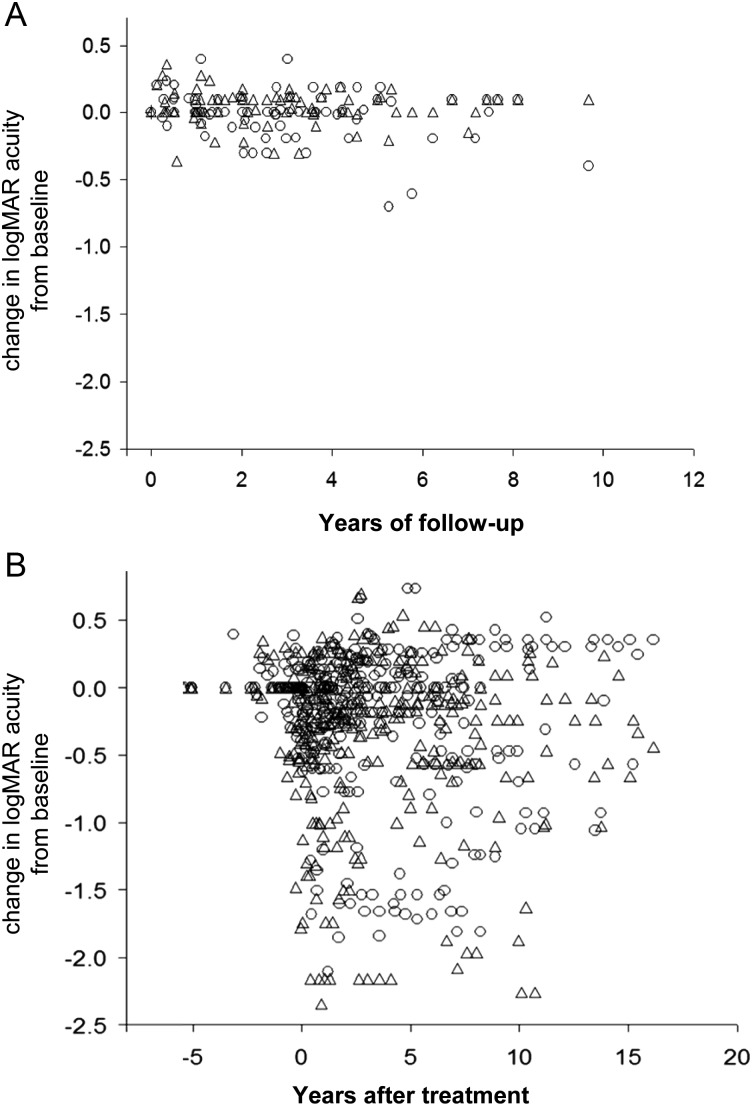
Fig. 1.
(A) Longitudinal changes in age-corrected visual acuity in patients with stable optic pathway gliomas. Visual acuity is represented as difference in logMAR from the baseline measurement, in which negative numbers represent worse visual acuity. (B) Longitudinal changes in logMAR in treated patients with respect to the initiation of treatment. Circles and triangles represent the right eye and left eye, respectively.

