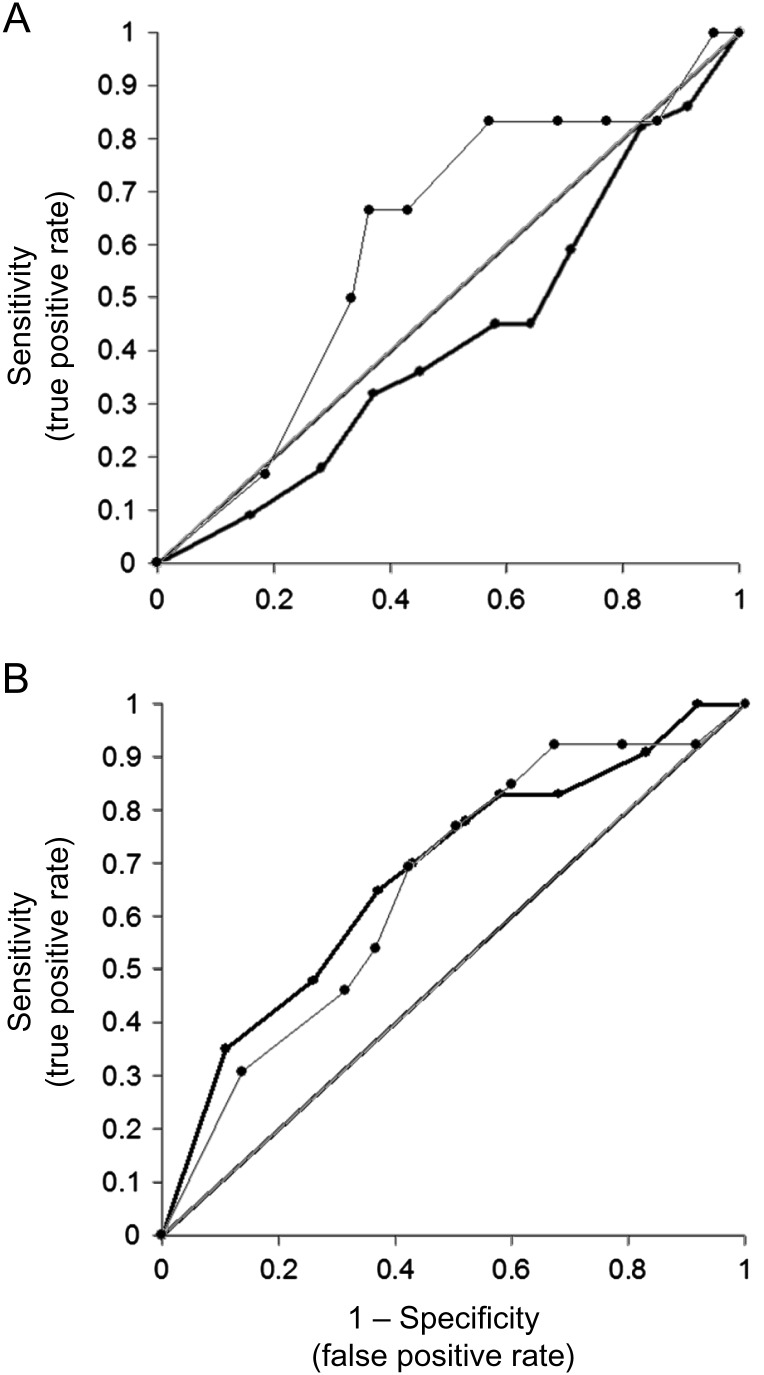
Fig. 5.
ROC curves for detecting increased size of tumor volume from serial changes in VEP amplitude in treated patients. Both eyes are included in the analysis, since there was no difference between the better and worse eye. The ROC curve is for (A) check reversal stimuli and (B) pattern-onset stimuli.

