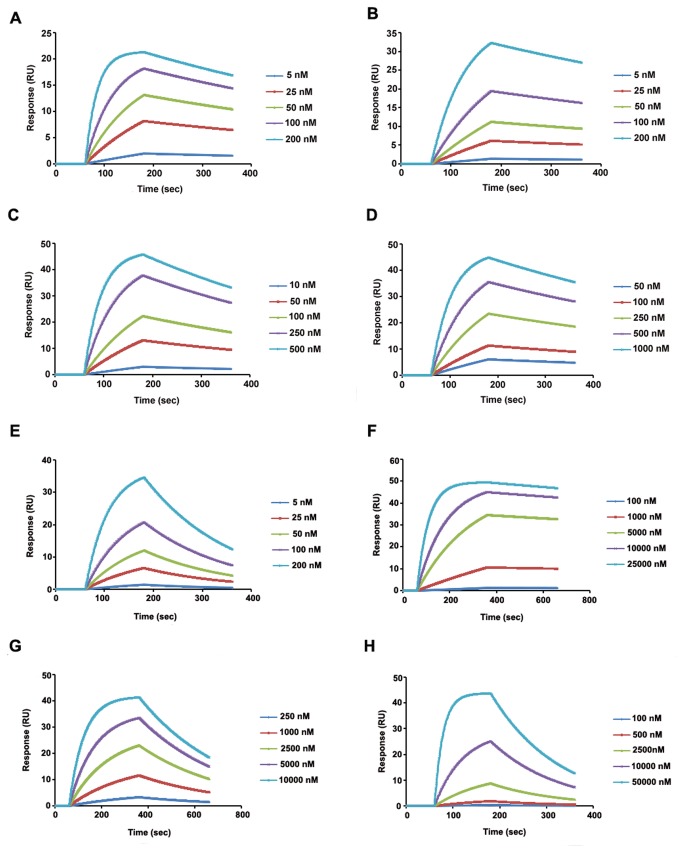
Figure 6. Sensorgrams of Cry1Ac binding.
The purified HaALP sample was immobilized on CM5 surface and five different concentrations of WT and mutant toxins were injected at a flow rate of 30 µl/min. Binding events were monitored and response curves were prepared by subtracting the signal generated simultaneously on the control flow cell. (A) Cry1Ac WT, (B) Q509A, (C) N510A, (D) R511A, (E) Y513A, (F) Triple mutant, (G) Tetra mutant, (H) W545A.

