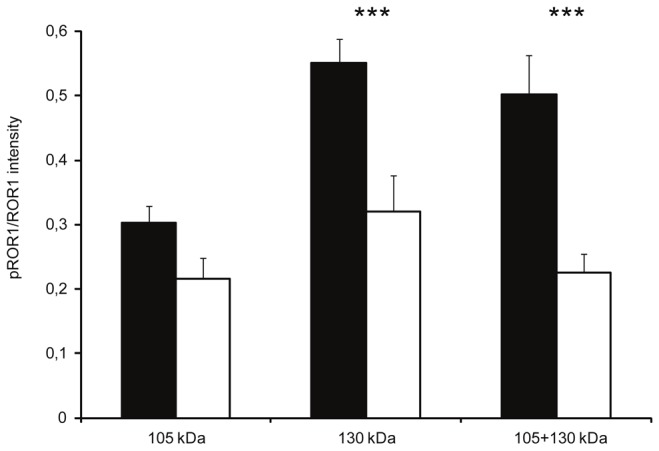
Figure 4. Differential phosphorylation of ROR1 isoforms in CLL in relation to disease activity.

pROR1/ROR1 intensity (mean ± SEM) of the 105, 130 and combined 105+130 kDa bands in progressive (■) (n=21) and non-progressive (☐) CLL patients (n=17). *** p= 0.001.
