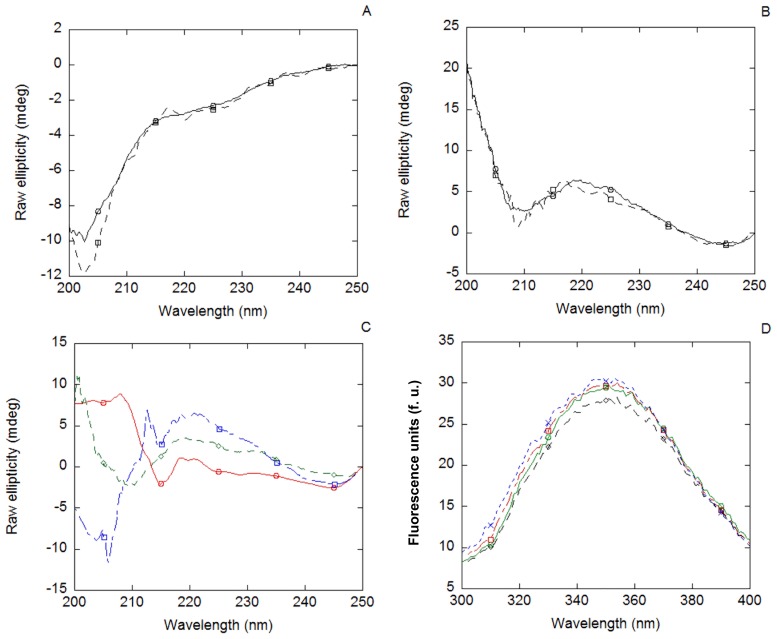
Figure 3. Binding of MSL1 to Nupr1 non-damaged-DNA followed by spectroscopic techniques.
(A) Far-UV CD spectrum of the MSL1 + Nupr1 complex (continuous line) and the addition spectrum resulting of the sum of the spectra of each isolated biomolecule (dashed line). (B) Far-UV CD spectrum of MSL1 + non-damaged-DNA complex (continuous lines) and the addition spectrum resulting of the sum of the spectra of each biomolecule (dashed line). (C) Far-UV CD spectrum of the MSL1 + non-damaged-DNA + Nupr1 complex (red line), the addition spectrum resulting of the sum of the spectra of each isolated biomolecule (blue line) and the addition spectrum resulting of the sum of the spectra of isolated MSL1 with that of the Nupr1 + non-damaged-DNA complex (green line). Differences between the ternary complex spectrum and both sum spectra suggest that MSL1 binds to the non-damaged-DNA + Nupr1 complex. (D) Fluorescence spectrum of MSL1 (red line) compared with those of MSL1 + Nupr1 complex (blue line), MSL1 + non-damaged-DNA complex (green line) and MSL1 + Nupr1 + non-damaged-DNA complex (black line).

