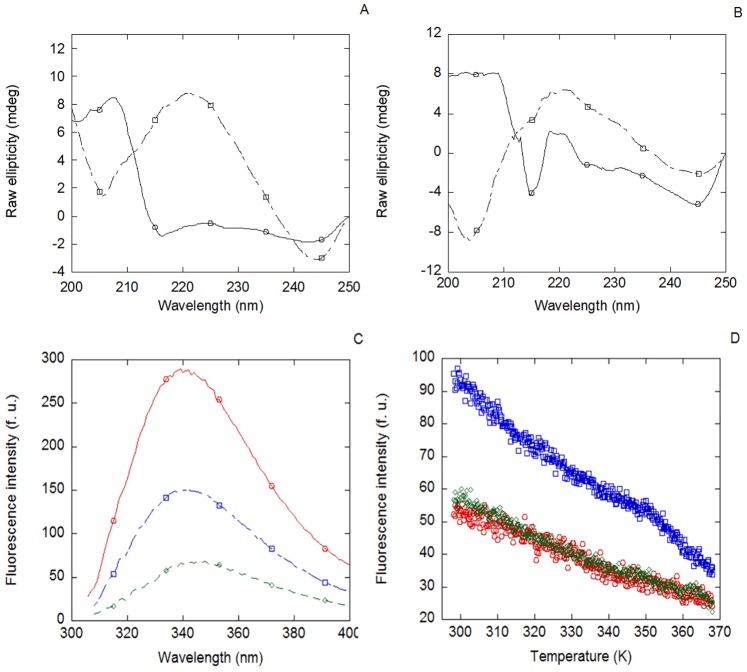
Figure 5. Binding of MSL1 to Nupr1 and/or etoposide-damaged-DNA followed by spectroscopic techniques.
(A) Far-UV CD spectrum of MSL1 + etoposide-damaged-DNA complex (continuous line) and the corresponding addition spectra resulting of the sum of the spectra of each biomolecule (dashed lines). (B) Far-UV CD spectrum of MSL1 + Nupr1 + etoposide-damaged-DNA complex (continuous line) and the corresponding addition spectrum resulting of the sum of the spectra of each biomolecule (dashed lines). (C) Fluorescence spectra of MSL1 (red line) and the complexes of MSL1 + etoposide-damaged-DNA (blue line) and MSL1 + Nupr1 + etoposide-damaged-DNA (green line). (D) Thermal denaturations at 315 nm followed by fluorescence at an excitation wavelength of 295 nm of MSL1 (red circles), MSL1 + etoposide-damaged-DNA (blue squares) and MSL1 + Nupr1 + etoposide-damaged-DNA (green diamonds). No sigmoidal behaviour was found on any of the complexes. Similar results were obtained by monitoring the fluorescence at 330 and 350 nm.

