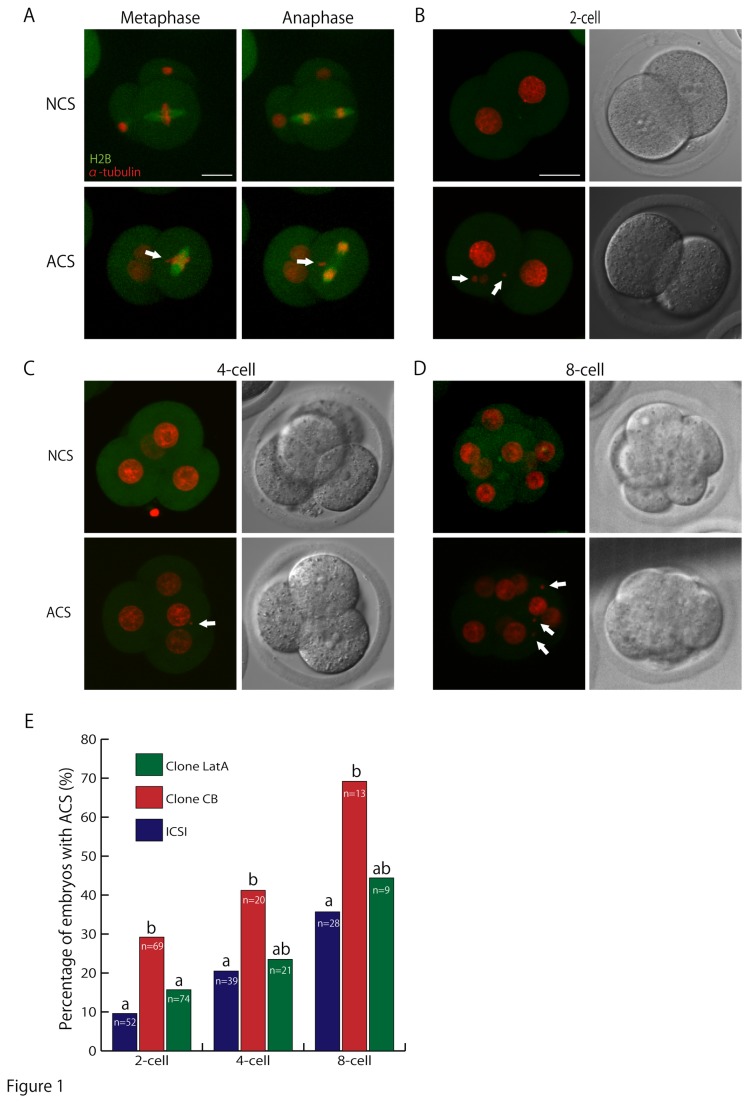
Figure 1. Chromosome segregation in early embryonic development.
(A) Chromosomes were misaligned at metaphase and lagging chromosomes were found at anaphase in embryos ACS was occured. (B-D) Merged and bright field images of embryos with normal chromosomal segregation (NCS) and abnormal chromosomal segregation (ACS). As an example, time-lapse images of chromosome segregation at the first, second and third mitosis are shown at the 2-cell, 4-cell and 8-cell stages, respectively. Arrows indicate chromosomal fragments appearing during the division. Green, EGFP-α-tubulin; red, mRFP–H2B. Bar = 30 µm. (E) The percentages of embryos with ACS at the 2-cell, 4-cell and 8-cell stages in ICSI-generated and cloned embryos. Values with different superscripts in the same category differ significantly between ICSI-generated, CB- and LatA-treated cloned embryos.

