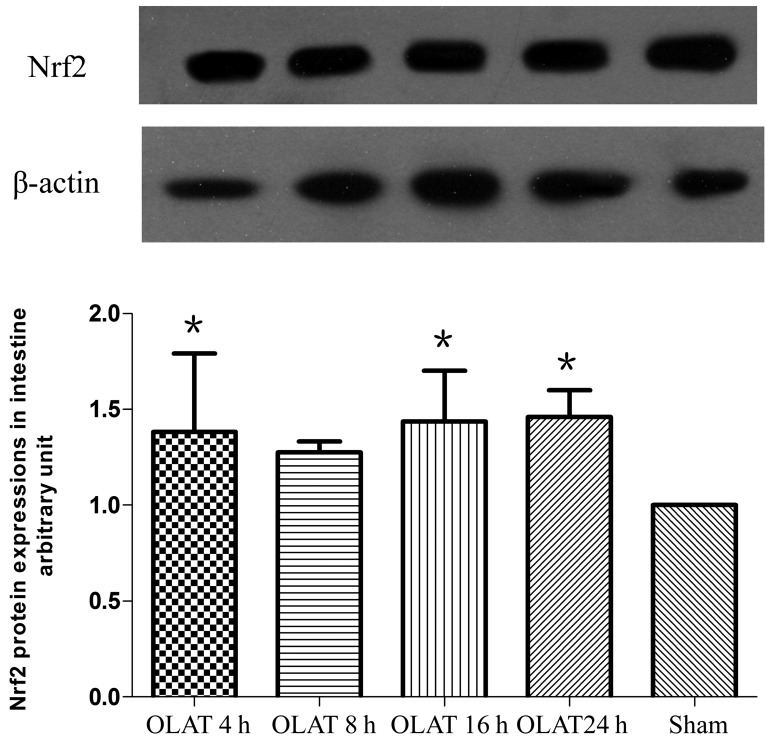
Figure 5.
Western blot analysis of the expression of small intestine NF-E2-related factor-2 (Nrf2). Results are presented as the mean ± SD (n=7/group). *P<0.05 compared with the sham group; $P<0.05 compared with the 4-h group; #P<0.05 compared with the 8-h group. OLAT, orthotopic liver autotransplantation.

