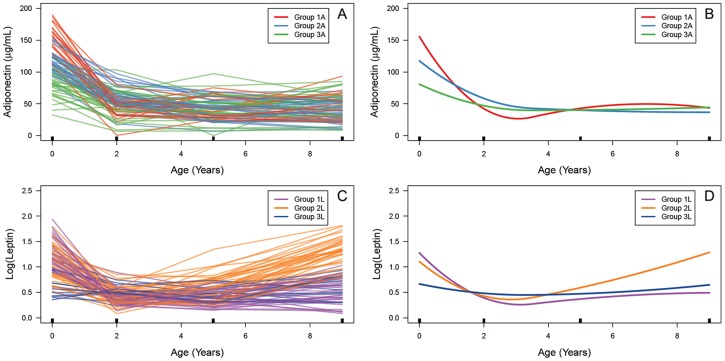
Figure 1. (A) Individual child adiponectin trajectories.
Black rectangles indicate age at which adiponectin was measured. Orange, blue, and green trajectories comprise groups 1A, 2A, and 3A, respectively, as identified by vertically-shifted mixture modeling (VSMM). (B) VSMM-defined adiponectin trajectory groups. (C) Individual child leptin trajectories. Purple, orange, and dark blue trajectories comprise groups 1L, 2L, and 3L. (D) VSMM-defined leptin trajectory groups.

