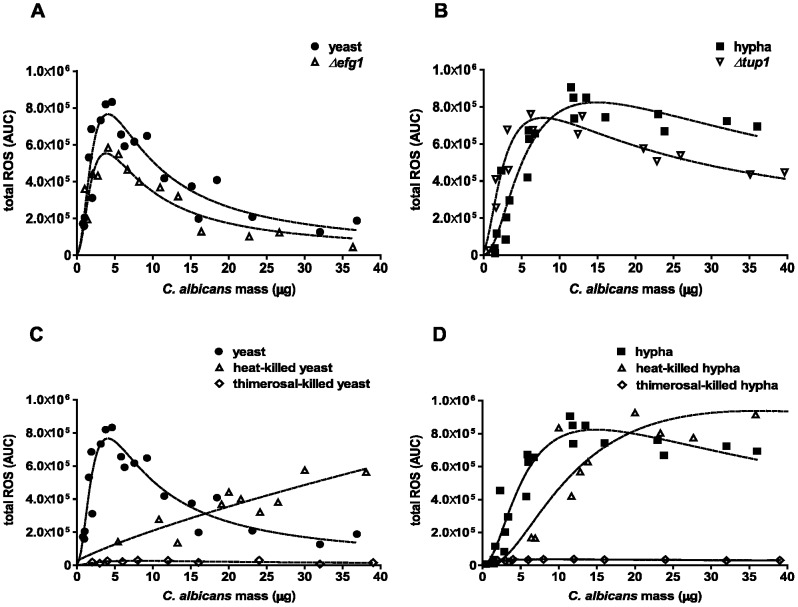
Figure 2. Neutrophil ROS response pattern depends on amount, morphotype and viability of C. albicans.
Neutrophil ROS generation was measured in a luminol-based assay. Different DM amounts of C. albicans were used to infect 105 neutrophils. Each data point represents AUC corresponding to the total ROS in the course of 3 h. Neutrophils were infected either with wild-type yeasts (closed circles) or Δefg1 mutant (open triangles) (A) or wild-type hyphae (closed squares) or Δtup1 mutant (open inverted triangles) (B). Neutrophils were infected with heat-killed (open triangles) or thimerosal-killed (open rhombuses) yeasts (C) or hyphae (D). The dashed line represents the best-fit curve of three individual assays from different donors. Masses to MOI conversion for 105 neutrophils: (Yeasts) 1 µg≙0.4, 5 µg≙2.1, 10 µg≙4.1, 20 µg≙8.2, 30 µg≙12.3; (hyphae) 1 µg≙0.2, 5 µg≙0.9, 10 µg≙1.7, 20 µg≙3.4, 30 µg≙5.1.

