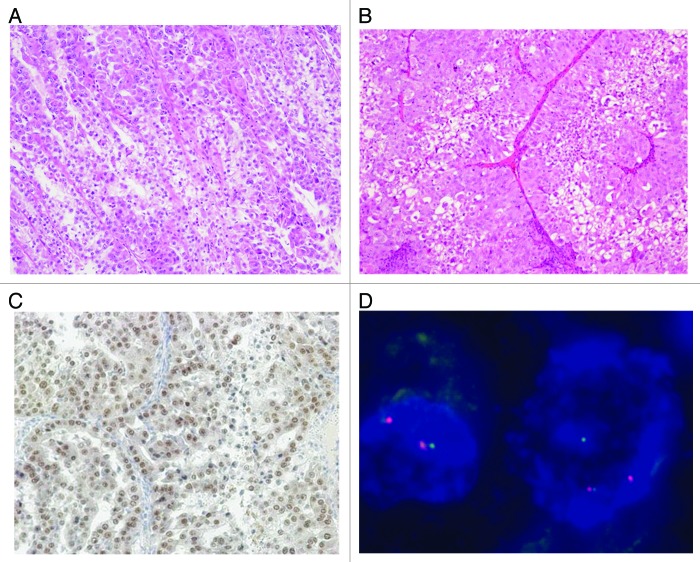
Figure 3. Microscopic features of the primary tumor and xenograft. (A) Histopathological features of the primary tumor (HE staining, magnification × 200). (B) Immunohistochemistry for TFE3 in the primary tumor shows strong nuclear staining (magnification × 200). (C) Interphase FISH analysis of the primary tumor with a dual-color, break-apart DNA probe. The TFE3 probes were labeled green at the centromeric site and orange at the telomeric site. Split signals are observed (arrows).

An official website of the United States government
Here's how you know
Official websites use .gov
A
.gov website belongs to an official
government organization in the United States.
Secure .gov websites use HTTPS
A lock (
) or https:// means you've safely
connected to the .gov website. Share sensitive
information only on official, secure websites.
