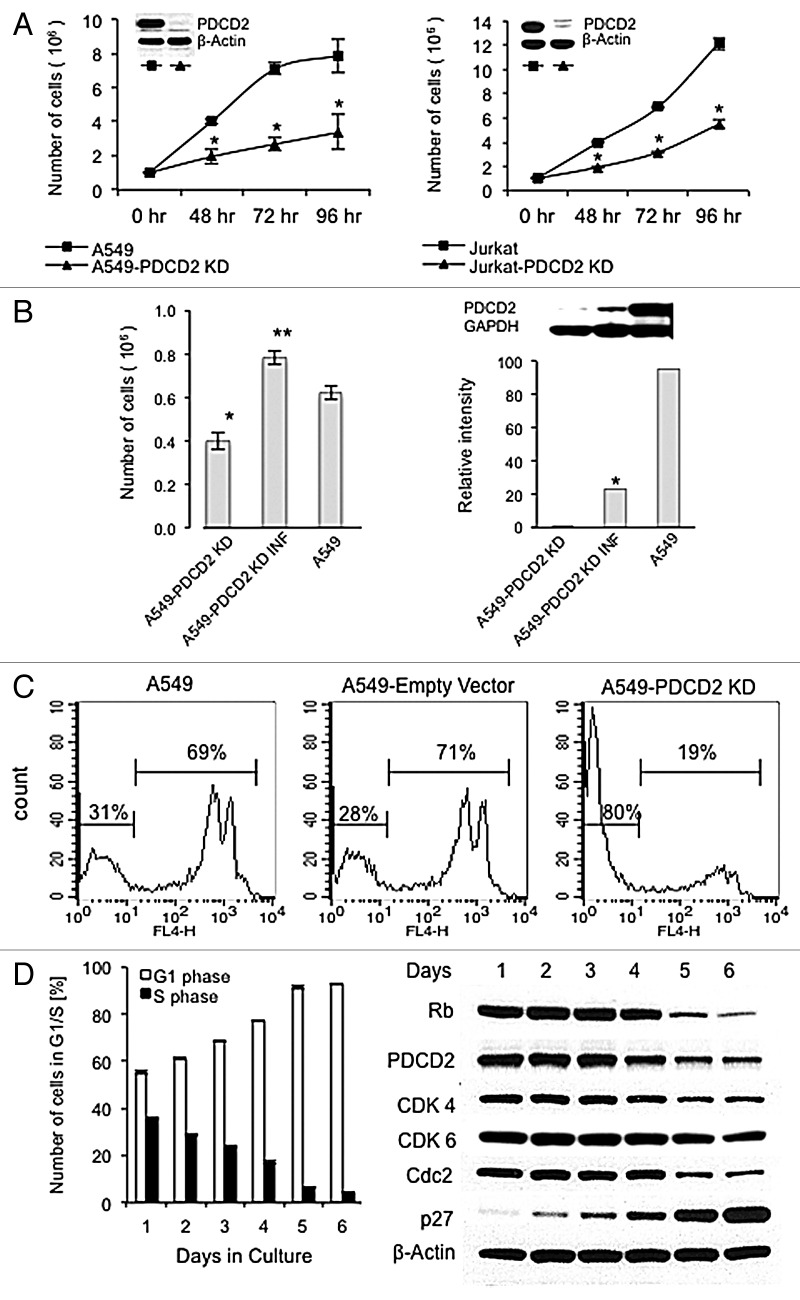
Figure 2. Analysis of PDCD2 knockdown on cell proliferation. (A) Cells were harvested at the indicated time points from parental and PDCD2 KD cultures and cell number was measured by automated trypan blue exclusion. Each time point performed in triplicate; error bars represent the standard deviation from the mean; (*) denotes statistical significance, p < 0.05. The insets show PDCD2 protein expression in the A549 and Jurkat PDCD2 KD cell lines. Cells were harvested from respective cultures that were 50–70% confluent and protein lysates prepared. Western blots were probed first for PDCD2 expression, then stripped and probed for β-actin as a loading control. (B) The first panel shows PDCD2 rescue in A549 KD cells after infection with the pMSCV-huPDCD2-shRNAR retrovirus increases cell proliferation. The second panel shows partial restoration of PDCD2 protein expression by pMSCV-huPDCD2-shRNAR retroviral infection by Western analysis. PDCD2 protein expression measured by densitometry and normalized to GAPDH expression. (C) DNA synthesis, as a correlate of S phase transition, was determined by EdU incorporation detected with Alexa Flour® 647 (FL-4) measured by flow cytometry. (D) PDCD2 protein expression is associated with cell proliferation. A549 cells initially seeded at 1 × 10⁵ per plate were cultured for the indicated time points and then cell cycle analysis was performed by propidium iodide staining followed by flow cytometry (left panel). The results presented represent the mean and standard deviations of three independent experiments. The expression of Rb, PDCD2, CDK4, CDK6, CDC2 and β-actin was analyzed in A549 at the indicated time points and increasing degrees of confluence (right panel).

An official website of the United States government
Here's how you know
Official websites use .gov
A
.gov website belongs to an official
government organization in the United States.
Secure .gov websites use HTTPS
A lock (
) or https:// means you've safely
connected to the .gov website. Share sensitive
information only on official, secure websites.
