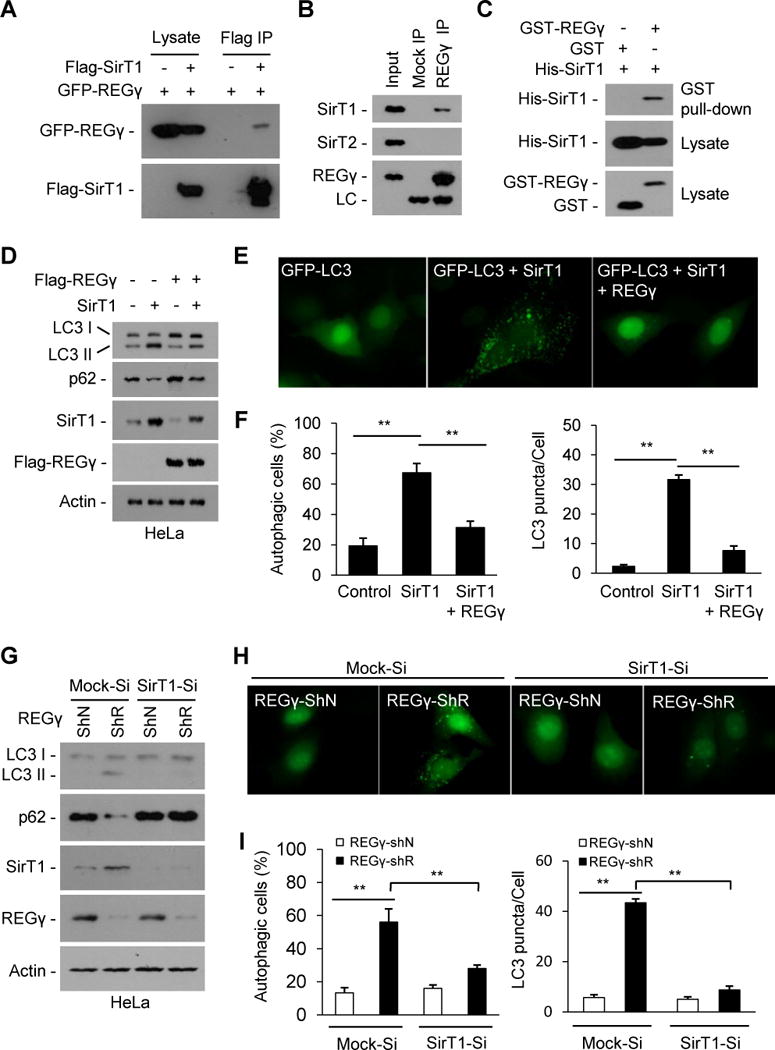
Fig. 3. REGγ inhibits autophagy in a SirT1 dependent manner under normal conditions.

(A–C) REGγ interacts with SirT1. (A) Flag-SirT1 and GFP-REGγ were expressed in the 293T cells and immunoprecipitated with FLAG-M2 agarose beads, and co-precipitated REGγ was detected by Western blot. (B) Endogenous REGγ in HeLa cells was precipitated using anti-REGγ antibody or with IgG (Mock IP), and co-precipitated SirT1 and SirT2 were detected by Western blot. (C) REGγ interacts with SirT1 in vitro. His-tagged SirT1 was incubated with GST-REGγ or GST proteins for 4 h at 4oC. REGγ-SirT1 co-precipitation was determined by GST pulldown and Western blot. (D–F) REGγ inhibits SirT1 autophagic function. (D) HeLa cells were transfected with indicated plasmids for 30 h. The conversion of LC3-I to LC3-II and levels of p62 were determined by Western blot. (E) REGγ inhibits SirT1-stimulated GFP-LC3 punctae formation. HeLa cells seeded on coverslips were transfected with GFP-LC3 and indicated plasmids for 30 h and GFP-LC3 were visualized by fluorescence microscopy. (F) The percentages of GFP-LC3 positive cells with GFP-LC3 punctae and the GFP-LC3 punctae per cell in panel E were quantified. Data represent mean ± s.d., ** P < 0.01. (G–I) SirT1 is required for REGγ-deficient induced autophagy (G) SirT1-knockdown attenuates REGγ knockdown-induced LC3-II accumulation and p62 reduction. HeLa cells with stable knockdown of SirT1 (SirT1-Si) or control vectors (Mock-Si) were infected with pLL3.7 vector (ShN) or REGγ-knockdown (ShR) lentivirus for 72 h. Cell lysates were western blotted for SirT1, REGγ, LC3 and p62. (H) SirT1 knockdown represses REGγ knockdown-induced formation of GFP-LC3 punctae. Cells in panel G were transiently transfected GFP-LC3 for 20 h and visualized by fluorescence microscopy. (I) The percentages of GFP-LC3 positive cells with GFP-LC3 punctae and the GFP-LC3 punctae per cell in panel H were quantified. Data represent mean ± s.d., ** P < 0.01. See also Fig. S3.
