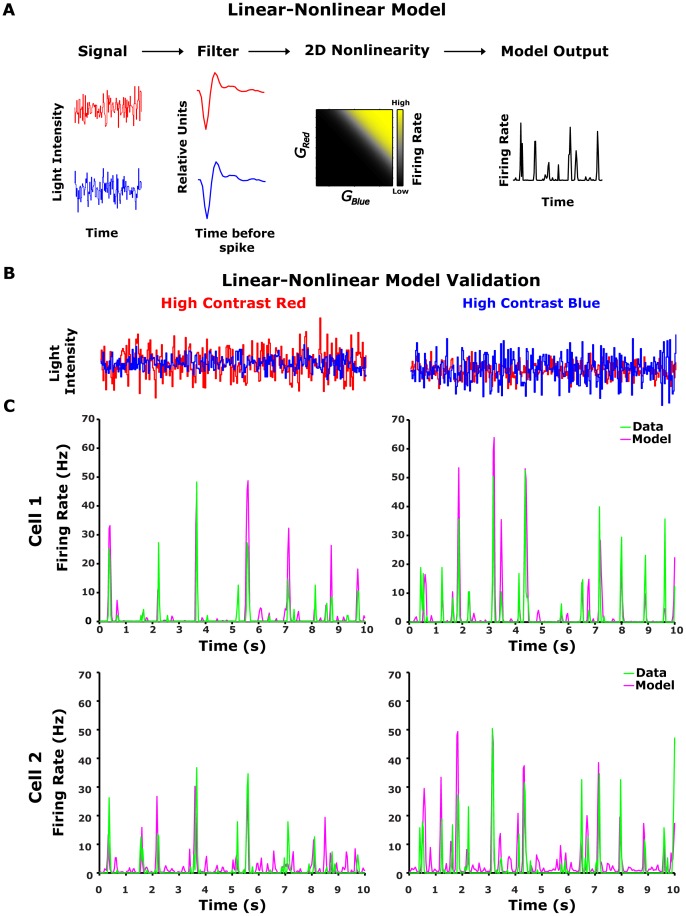
Figure 2. Linear-nonlinear model analysis.
(A) Schematic overview of the LN model. The red and blue stimuli were convolved with red ( ) and blue (
 ) linear filters, respectively, and the product was passed through a static nonlinearity (
 ), resulting in a prediction of the LN model for ganglion cell firing rate. (B-D) Testing the LN model for two colour contrast conditions. Left column: high red (24%) and low blue (12%) colour contrast. Right column: high blue (24%) and low red (12%) colour contrast. (B) Intensities of red and blue light stimuli (red and blue curves) used in the experiment. (C) LN model prediction for two example cells compared to the experimental data. Data was averaged over 20 trials (bin size 33 ms). The LN model output (magenta coloured line), constructed from a separate data set, follows the data (green line) closely (correlation coefficients were 0.72 and 0.75 for the Cell1 (upper panel) and 0.36 and 0.61 for Cell2 (lower panel) for high red and high blue contrasts respectively).

