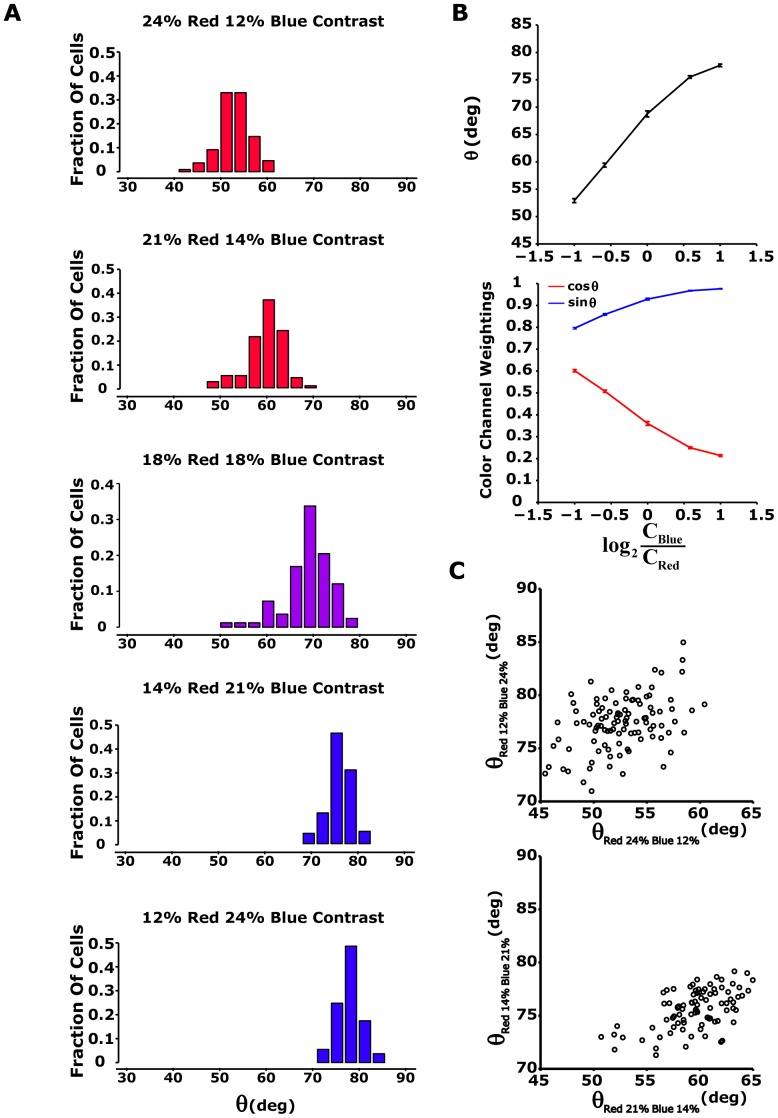
Figure 7. Modification of rotation angle  by colour contrast modulation.
(A) Histogram of rotational angle for different colour contrast modulations. Upper and lower panels: rotation angle histogram (n = 117 cells, from one of four experiments) for 24% red and 12% blue contrast stimuli (red bars) and for 12% red and 24% blue contrast stimuli (blue bars). Second and forth panels: high colour contrast is lowered to 21%, while low colour contrast is changed to 14% (n = 109). Middle panel: 83 ganglion cells are excited by red blue stimuli with equal colour contrasts (18%). (B) Upper panel: summary of results from Figure 4A. The angle  was averaged along the ganglion cell population as a function of colour contrast modulation:
  (
( - contrast blue,
  - contrast red). Error bars show standard error. Lower panel: average
  (red) and
  (blue). Here,
  and
and  represent red and blue colour channel weightings, respectively, since 1D nonlinearity is a function of
  . Error bars represent standard error. (C) Rotation angle
  measured at high blue contrast plotted as a function of angle
  measured at high red contrast for all analyzed cells for 24% and 12% contrast (upper panel) and for 21% and 14% contrast (lower panel). It appears that there is a positive correlation between
  measured at high blue contrast and
  measured at high red contrast.

