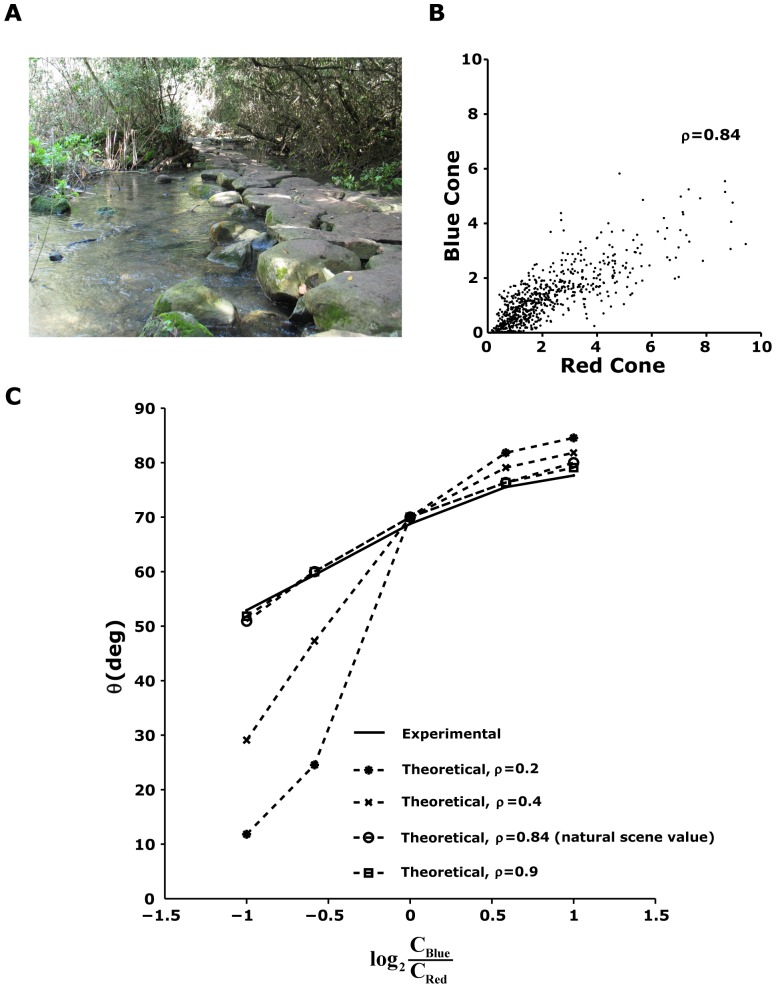
Figure 8. Natural scene statistics in the salamander natural environment can explain the selection of the adaptation parameter  .
.
(A) A typical scene in the Tel Dan Natural Reserve (courtesy of Dr. Hava Goldstein). (B) To evaluate the correlation between light levels in the red and blue regions of the spectrum, each measured natural spectrum was convolved with the salamander red and blue photopigment absorption spectra to give us a measure of the amount of input available for the retinal circuitry in the two colours. The red and blue channels were shown to be strongly related, with a correlation coefficient of 0.84. (C) For each ratio between the contrasts in the two input channels, we found the optimal angle  that maximizes the information transfer between the input and the response. We found that if the two input variables were strongly correlated, the value of the experimentally measured angle from the retina coincides with the value we obtained from the model given the bias in the natural environment toward the blue channel. This suggests that the retinal circuitry optimally selects the adaptation parameter to maximize information transmission.

