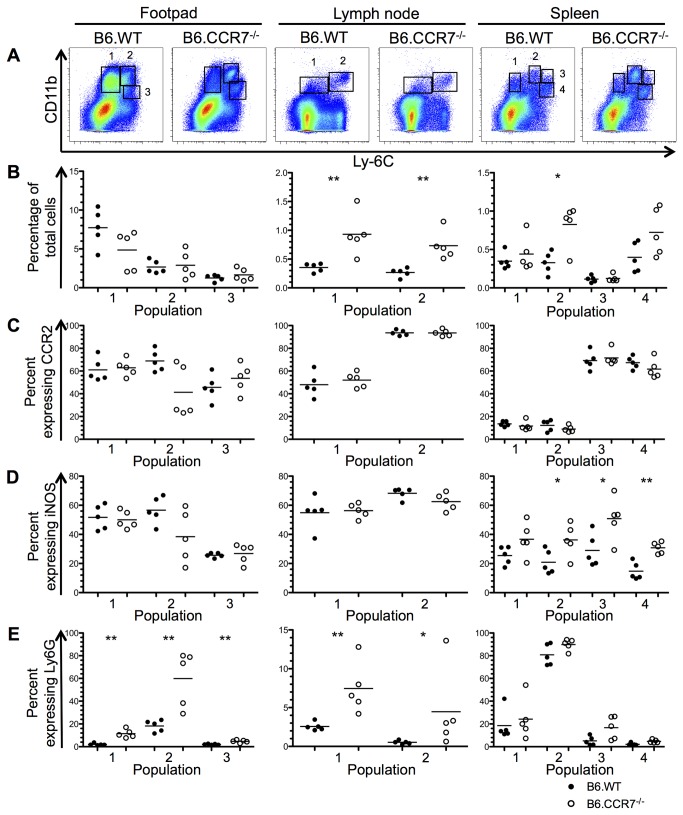
Figure 5. Characterisation of monocytic populations in B6.WT and B6.CCR7-/- mice at day 42 post infection.
(A) Populations of monocytes in each tissue were defined by flow cytometry according to their CD11b and Ly6C expression. (B) The percentage of these populations in each tissue is shown in B6.WT (closed circles) and B6.CCR7-/- (open circles) mice. The expression of CCR2 (C), iNOS (D) and Ly6G (E) was determined by flow cytometry and displayed as a percentage of each population. One representative analysis of three experiments; Experimental group size: n=5 mice/genotype; *p<0.05; **p<0.01.

