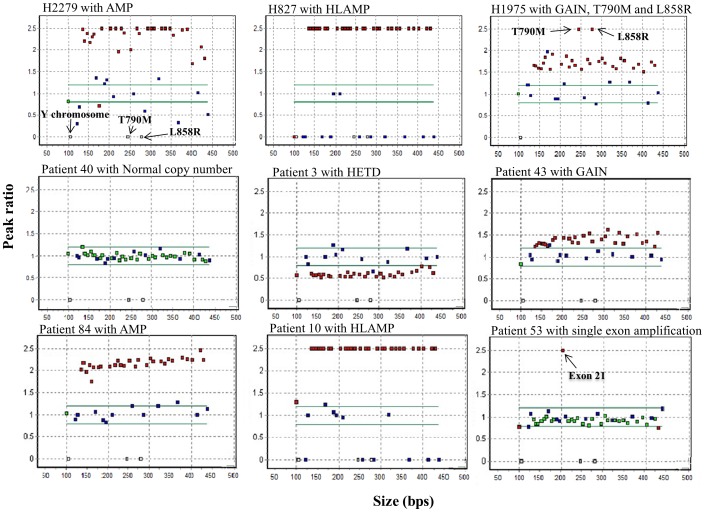
Figure 1. Examples of representative scatter plot patterns of multiplex ligation-dependent probe amplification (MLPA) analysis for the EGFR gene.
Gain or loss (peak ratio cut off, <0.8 or >1.2) of exons in EGFR gene were represented by red squares. Green square indicated within neutral peak ratio of EGFR gene. Three white squares indicate specific probe for Y chromosome (105 bps), the L858R (281 bps) and the T790M mutations (246 bps). Blue squares represent control probes. ‘HETD’, hemizygous deletion; ‘GAIN’, copy gain; ‘AMP’, amplifications; ‘HLAMP’, high-copy amplifications.

