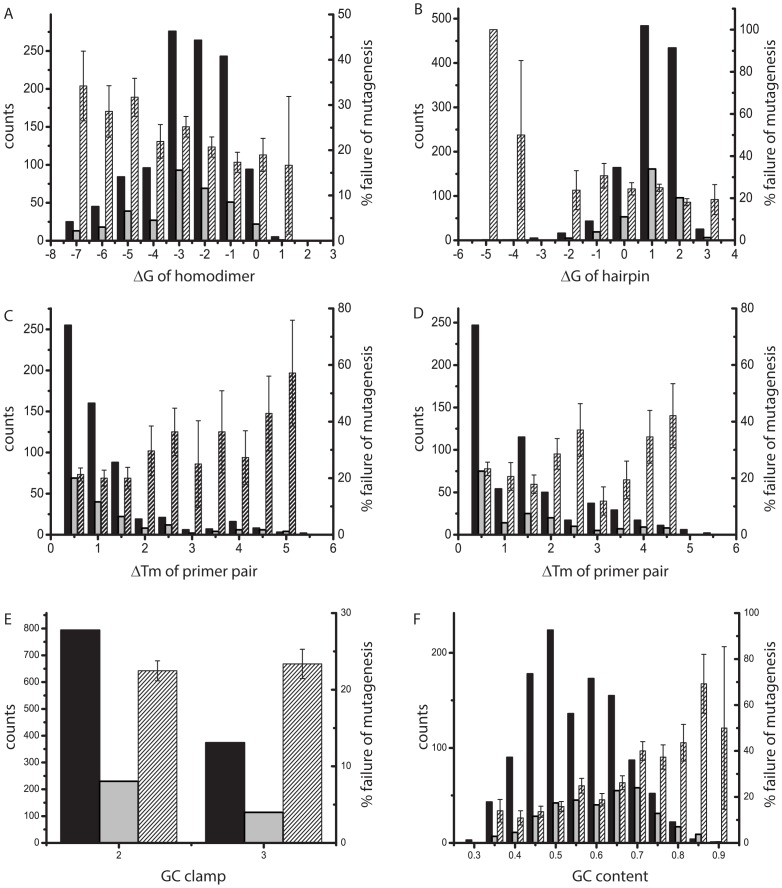
Figure 7. Influence of secondary structure and melting temperatures of primers on the success of mutagenesis.
Features of primer pairs (ΔTm) are counted once, features of single primers (ΔG) were counted separately for the reverse and forward primer of a pair and are represented in one graph. Solid bars represent the number of primers with a particular value of a feature (left axis), striped bar represent the fraction failed (right axis). The standard deviation of the fraction failed was calculated as (f*(1-f)/N)1/2, where f is fraction failed and N is the total number of primers in a particular category. Success (black) or failure (grey) of mutagenesis, as well as fraction failed (striped) in dependence of (A) the ΔG of hairpins formed by the primers, (B) the ΔG of homodimers formed by the primers, (C) primer melting temperatures calculated for mutation of the native DNA (early PCR cycles), (D) primer melting temperatures calculated for mutation of the DNA containing the mutation (later cycles of PCR), (F) quality score of the GC clamp and (G) GC content of the primer.

