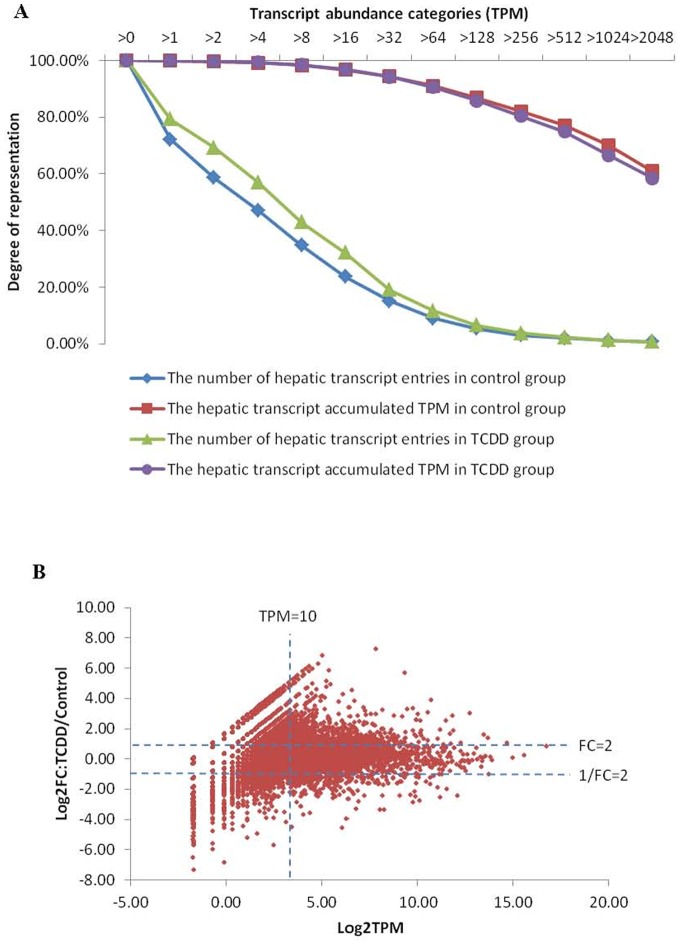
Figure 1. Comparison of transcriptomic profiles between TCDD and control groups.
(A) Distribution of transcript entries and total transcript counts over different tag abundance categories in liver of zebrafish. The percentages of total transcript counts and number of different transcript entries per category are plotted on a log scale (base10). (B) Relationship between the hepatic transcriptome changing range and its expression level in zebrafish after TCDD treatment. The base of log value is 2.

