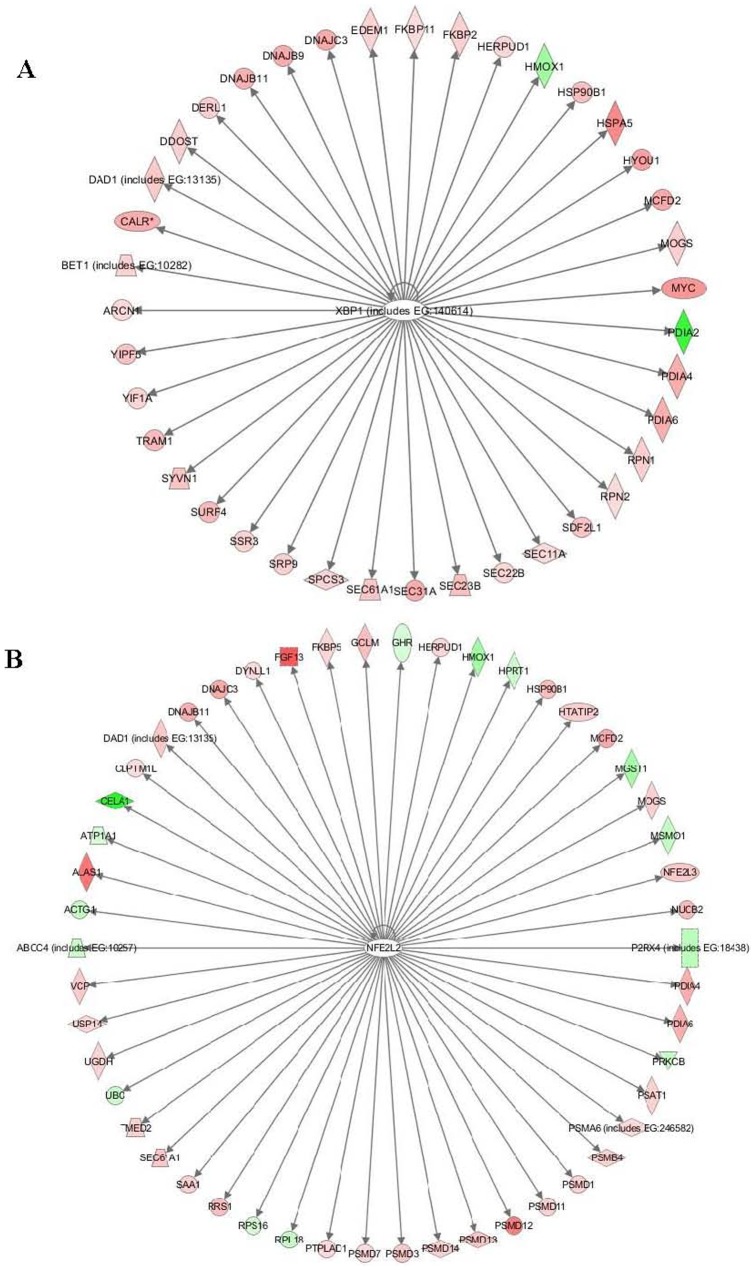
Figure 3. Two most significant transcription factor networks in the zebrafish liver in response to TCDD exposure.
(A) Xbp1 network. (B) Nfe2l2 network, Target genes in the differentially expressed gene list (Table S1) are shown with red color indicating up-regulation and green color down-regulation. The intensity of the color corresponds to the relatively levels of up- and down-regulation.

