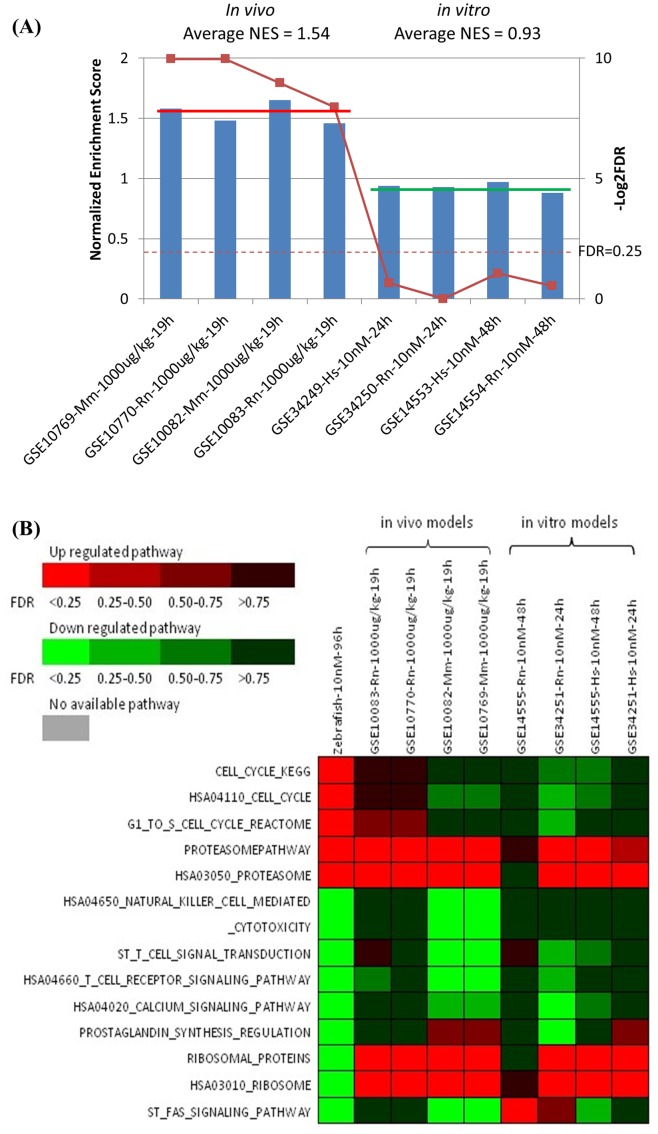
Figure 4. Comparative analyses of zebrafish and mammalian transcriptomic data from TCDD treatments.
(A) Correlation of hepatic transcriptome changes in the zebrafish with the mammalian in vivo and in vitro models by GSEA analysis. –Log2FDR = 2, that means FDR = 0.25. (B) Comparison of the pathways in zebrafish and the mammalian models by GSEA analysis. The heat map includes the significant pathways in zebrafish and mammalian models treated by TCDD, the criteria of zebrafish pathways is FDR<0.25.

