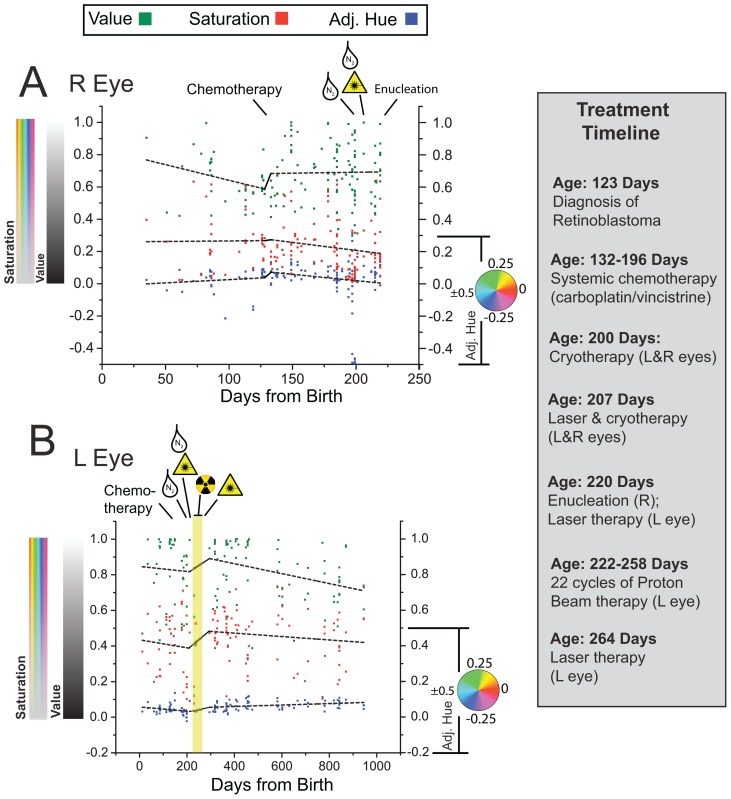
Figure 8. Longitudinal Plot of HSV Quantities of Leukocoria in Patient Zero.
In order to project quantities of Hue in a Cartesian coordinate, we converted quantities of Hue to a linear scale. A) Plot of average HSV (per pixel) for leukocoric pupils from right eye. A linear fit of data points was made for two time periods: before and after systemic chemotherapy. B) Plot of average HSV (per pixel) for leukocoric pupils from left eye throughout the three-year period of photography. A linear fit of data points was made for two time periods: before the administering of proton beam radiation therapy, and after the completion of therapy (treatment timeline is listed at right panel).

