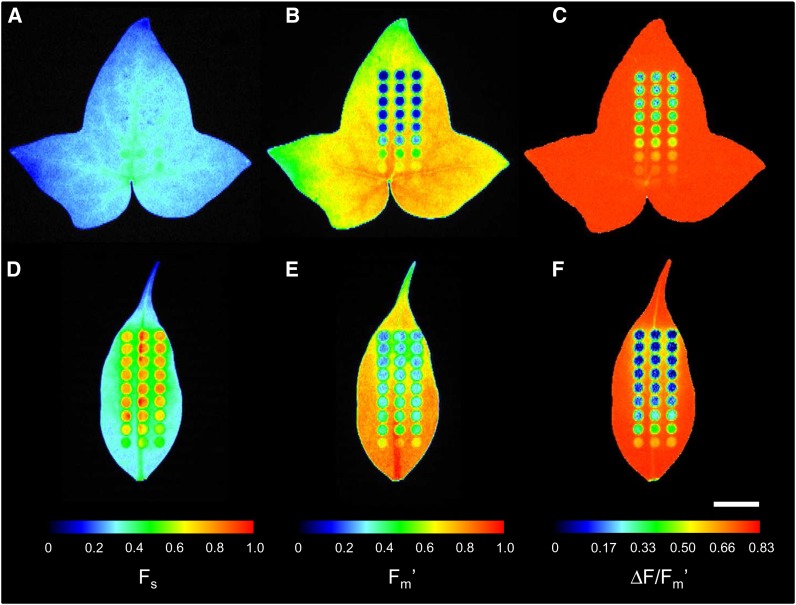
Figure 4.
Example of the application of an actinic light mask on leaves of HL-acclimated ivy (A–C) and LL-acclimated weeping fig (D–F). Images (false color scale) show Fs (A and D), Fm′ (B and E), and ΔF/Fm′ (C and F) measured after 6 min of exposure to the light mask following a period of 20 min in the dark. Fluorescence levels Fs and Fm′ were normalized to the range of pixel values in each leaf. Bar = 1 cm.

