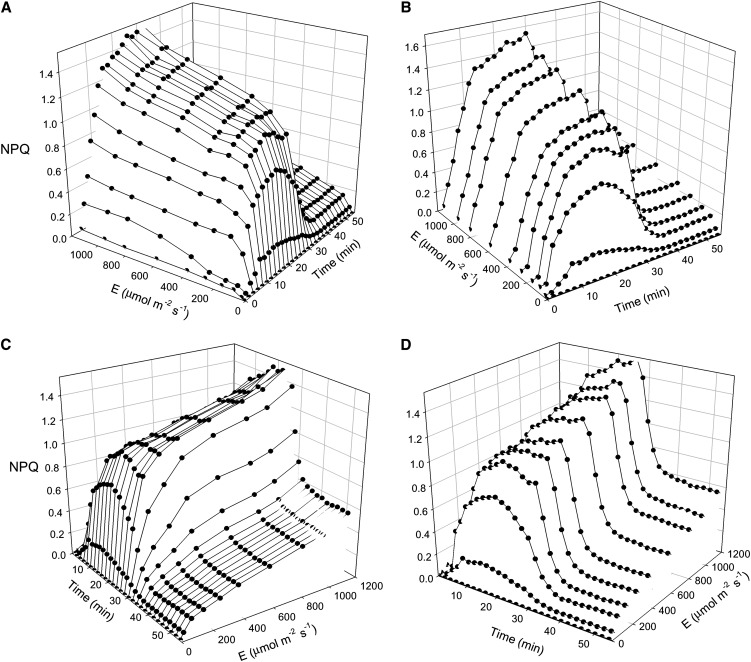
Figure 8.
Dynamic light response: light stress-recovery experiment. The three-dimensional representation shows the time and light responses of NPQ of a LL-acclimated weeping fig leaf, highlighting the variation over time of the LC (A and C) or the light induction and dark relaxation kinetics (B and D). Light exposure followed a 20-min dark adaptation.

