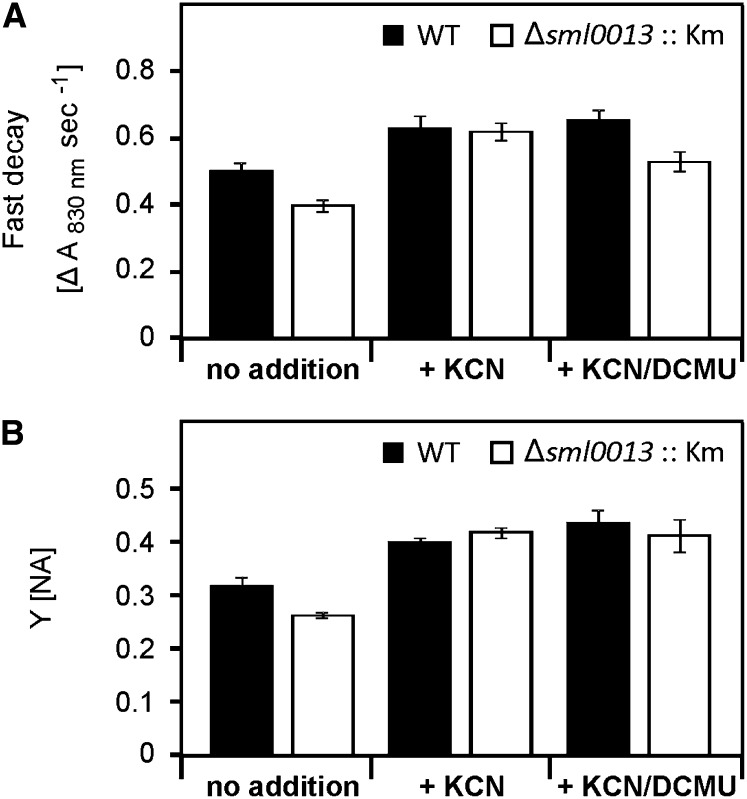
Figure 5.
Quantitative evaluation of the measurements of redox kinetics of PSI. Cells precultured under HC conditions of the wild type (WT) and the mutant Δsml0013::Km were measured without the addition of inhibitors, after the addition of KCN to inhibit electron flow into the respiratory electron chain toward Cytc oxidase, and after combined addition of KCN and DCMU to inhibit both respiratory and photosynthetic linear electron flow from PSII. From the slow kinetics, we calculated the rates of the decay phase after switching off far-red light (A). From the fast kinetics, the Y(NA) was calculated (B), reflecting the amount of PSI that can be oxidized under the different conditions. Mean values and sd from one typical experiment are shown (n = 3).

