Figure 2.
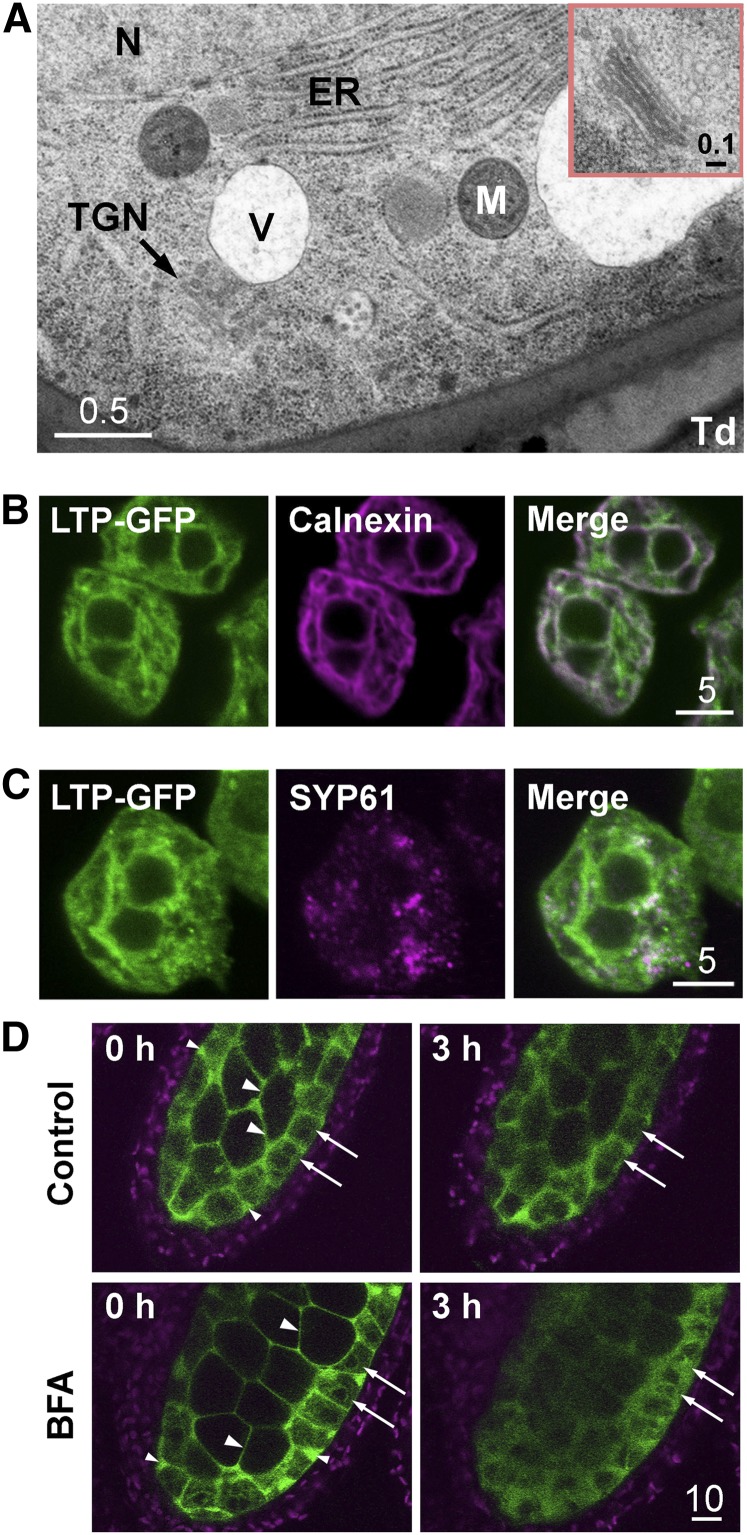
Localization of At5g62080-GFP and organelle markers in early stage 7 flowers in Arabidopsis. A, TEM of a portion of a tapetum cell, revealing ER, vacuole (V), nucleus (N), mitochondrion (M), TGN, and the adjacent locule with a small portion of a tetrad (Td). The inset shows an enlarged, well-defined Golgi body. Scale bars are in μm. B, CLSM of tapetum cells of plants transformed with At5g62080-GFP, revealing fluorescence of At5g62080-GFP (in green) overlapping substantially with the ER marker calnexin (detected with antibodies; magenta), with overlapped areas in white. The twin dark spheres represent two nuclei. C, CLSM of a tapetum cell of plants transformed with At5g62080-GFP, revealing fluorescence of At5g62080-GFP (in green) overlapping partly with the TGN marker SYP61 (detected with antibodies; magenta), with overlapped areas in white. The twin dark spheres represent two nuclei. D, Treatment of anthers of At5g62080-GFP-transformed plants with BFA, an inhibitor of the TGN secretory pathway. Anthers were incubated with or without 20 μg mL−1 BFA for 3 h, and fluorescence of At5g62080-GFP (in green) was observed. The same settings (laser power and detection gain) were used for direct comparison of the anthers before and after treatment. Slight losses of fluorescence and its sharpness had occurred after the 3-h treatment. Arrows indicate the tapetum cells; large arrowheads indicate the locule space between microspore mother cells, and small arrowheads indicate the apoplastic space between tapetum cells. Chlorophyll autofluorescence from cells of the outer wall is in magenta.

