Figure 3.
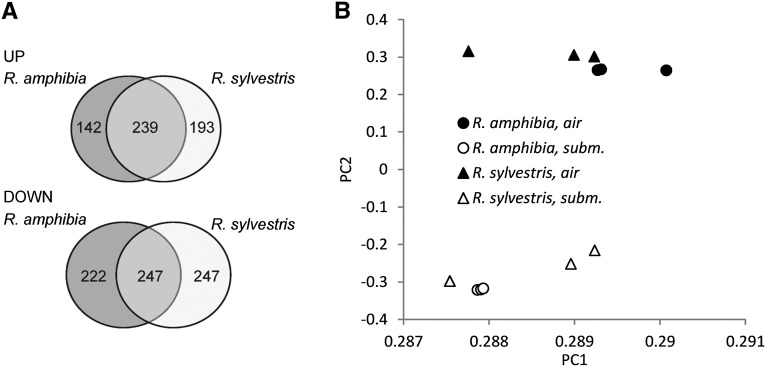
Root transcriptome profiles of Rorippa species using Arabidopsis gene chips. A, Numbers of genes regulated by submergence treatment and overlap between species. Within each genotype, expression values of submergence-induced genes show a ratio of submerged to air of greater than 2.0, and submergence-repressed genes show a ratio of submerged to air of less than 0.5 with a significant treatment effect (FDR < 0.05; t test with multiple testing correction according to Benjamini and Hochberg, 1995). B, Results of PCA applied to the expression of all the genes represented on the microarray. A probe mask with a threshold of 80 was applied to the expression data. For each of the 12 microarrays, expression data of 21,288 genes were used as input.

