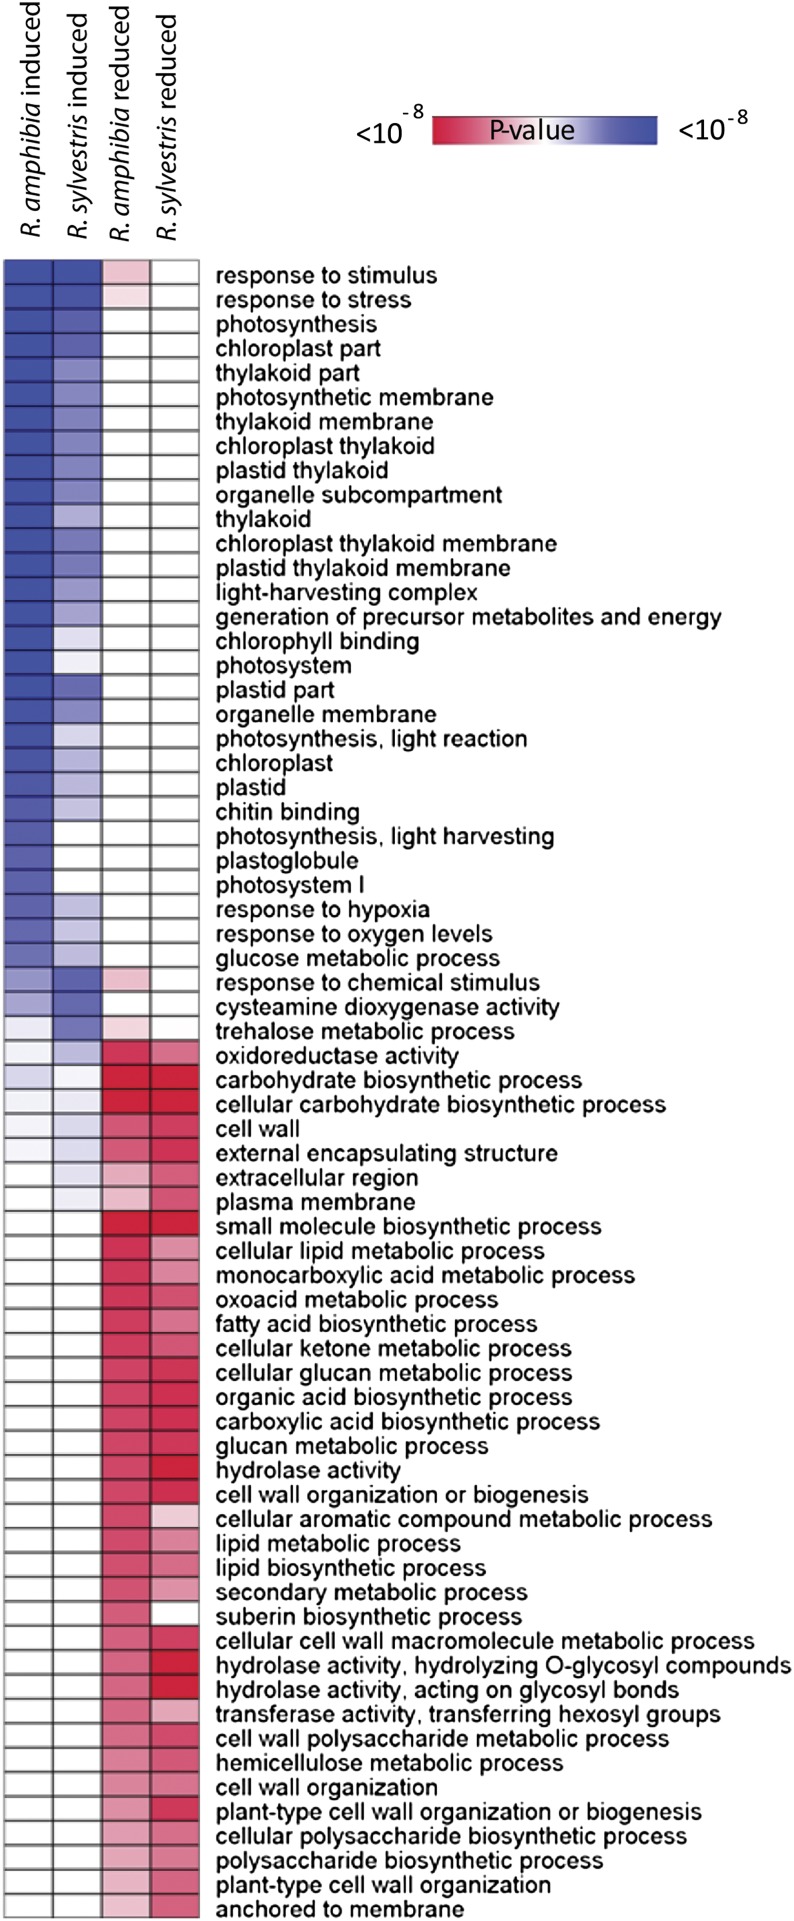
Figure 4.
Overrepresentation analysis of Rorippa species microarray data. Enrichment of GO categories of the lists of significantly induced or reduced genes (signal log ratio > 1 or < −1, FDR < 0.05; Supplemental Table S1) was calculated by use of the GOHyperGAll function in R (Horan et al., 2008). Selected significantly enriched GO terms are shown; a full list of GO terms is found in Supplemental Table S2. Statistical significances of GO term enrichment are represented by a false-color heat map (blue = up-regulated genes, red = down-regulated genes). Categories of GO terms that were significantly overrepresented are indicated with increasing color intensity (blue or red).

