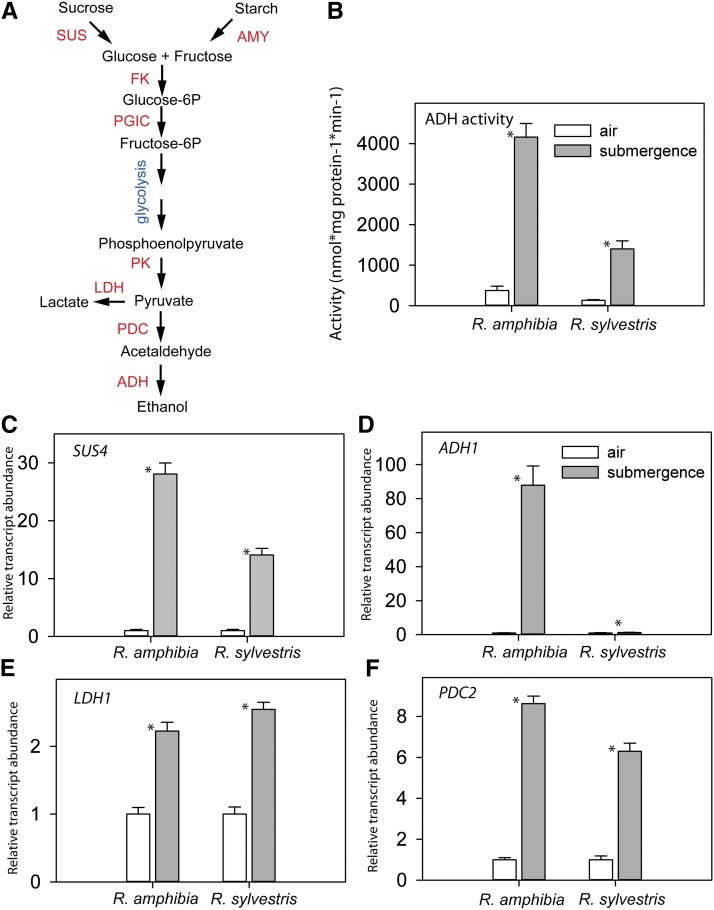
Figure 5.
Regulation of anaerobic metabolism. A, Schematic representation of the metabolic pathway showing sugar and starch breakdown feeding into glycolysis and fermentation. This simplified scheme is after Bailey-Serres and Voesenek (2008). B to F, Relative transcript abundance measured by qRT-PCR of Rorippa species homologs of ADH (B), SUS4 (C), ADH1 (D), PDC2 (E), and LDH1 (F) activity measured in roots of 24-h submerged Rorippa species plants. For ADH activity, data are means and sd (n = 5). For transcript abundance levels, data are means and SE (n = 4). Asterisks above the bars indicate significant differences between control and submerged samples (Student’s t test, P < 0.05). [See online article for color version of this figure.]

