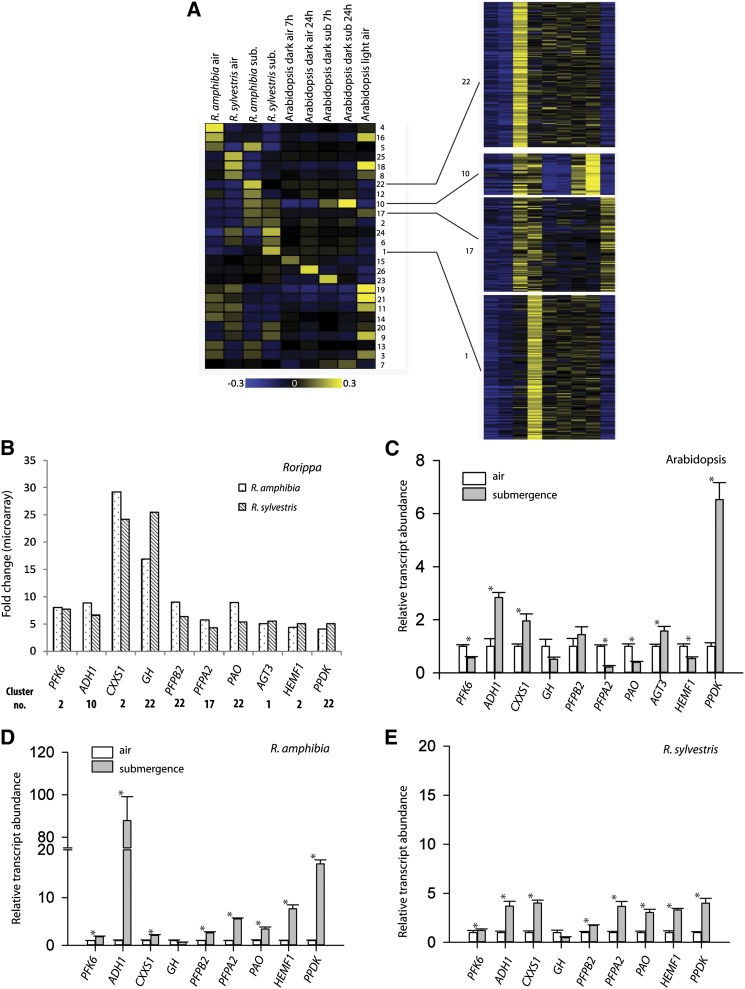
Figure 7.
Comparison of the submergence response of tolerant Rorippa species and sensitive Arabidopsis. A, Cluster analysis of root transcript profiles of Arabidopsis (Lee et al., 2011) and Rorippa species subjected to 24 h of submergence. RMA-normalized expression values were transformed as described in “Materials and Methods” and then clustered with the PAM function in R. The mean of each cluster is shown on the left side, and all genes of four selected clusters are shown on the right side. B, D, and E, Transcript levels of Rorippa species homologs of selected genes from indicated clusters as measured by microarray (B) and qRT-PCR (D and E) analyses in roots of 24-h submerged Rorippa species plants. Microarray data are fold change ratios of submergence versus control. C, Transcript abundance of the genes indicated measured using qRT-PCR in roots of Arabidopsis plants submerged for 24 h under conditions identical to those used for Rorippa species microarrays. Data in B to E are means of the relative transcript levels and se (n = 3 for C and n = 5 for D and E).

