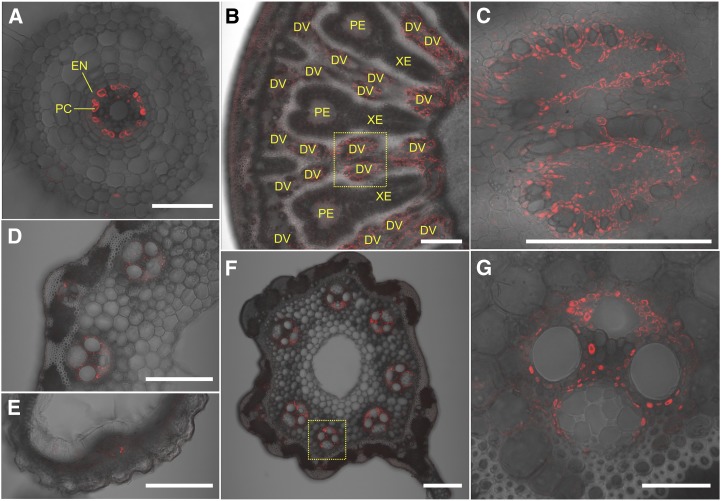
Figure 2.
Tissue specificity of OsHMA5 expression. Immunostaining of pOsHMA5-GFP transgenic rice with an anti-GFP antibody was performed in different organs, including root (A), node I (B and C), peduncle (D), husk (E), and rachis (F and G). Areas boxed with broken lines in B and F are magnified in C and G, respectively. Red color shows signal from GFP antibody detected with a secondary antibody. DV, Diffuse vascular bundles; EN, endodermis; PC, pericycle; PE and XE, phloem and xylem region of enlarged vascular bundles, respectively. Bars = 50 µm (A and G) and 200 µm (B–F).

