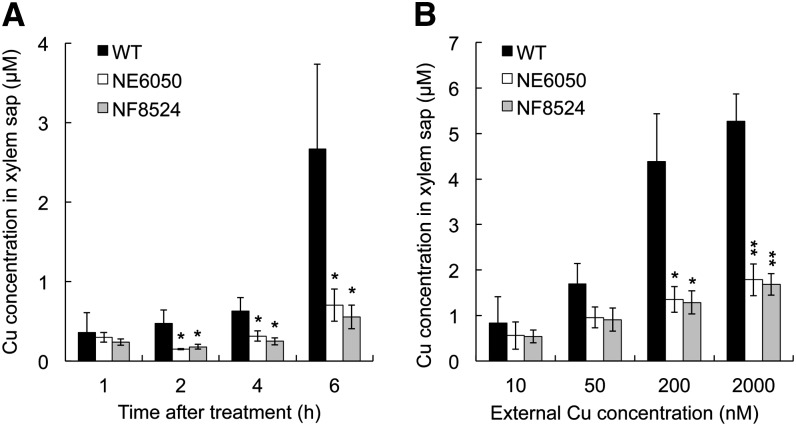
Figure 7.
Characterization of Cu in xylem sap. A, Time-dependent change of Cu in the xylem sap. B, Dose response of Cu in the xylem sap. Xylem sap was collected from the wild-type rice (WT) and the knockout lines (NE6050 and NF8524) exposed to 200 nm Cu for different times (A) or to different Cu concentrations (B). Data are means of three biological replicates. Asterisks above the bars indicate significant differences (*P < 0.05 and **P < 0.01) between the wild-type rice and the knockout lines by Tukey’s test.

