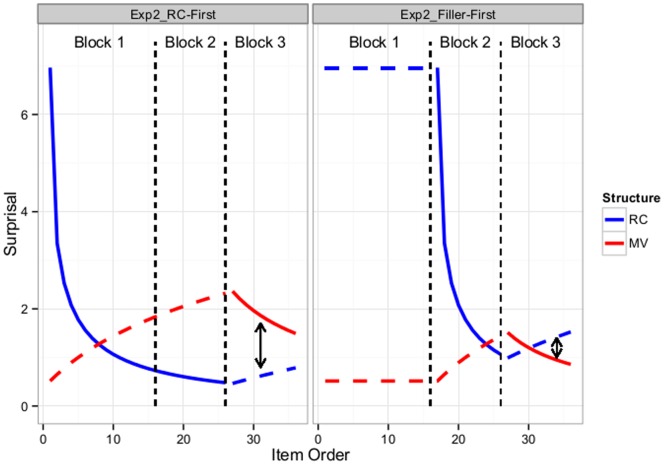
Figure 6. Predicted changes in surprisal for Experiment 2.
Predicted changes in surprisal for the RC-First (left panel) and Filler-First (right panel) groups for both RCs (blue) and MVs (red). Dashed lines indicate predicted changes in surprisal of structures not present in a given block (e.g., the surprisal of MVs is predicted to change throughout Blocks 1 and 2 as a result of the occurrence of RCs, but no MVs actually occur in those blocks). Black arrows indicate the average predicted surprisal of MVs relative to RCs during Block 3.

