
Figure 7. Results of Experiment 2.
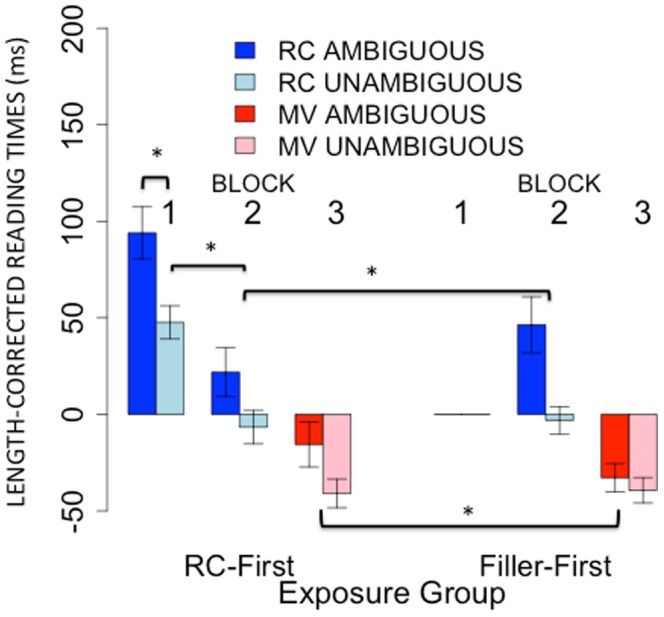
Mean length-corrected reading times in each block for the RC-First and Filler-First experimental groups. Error bars represent 95% confidence intervals on the means. Brackets with asterisks (*) indicate significant comparisons. For details, see main text.