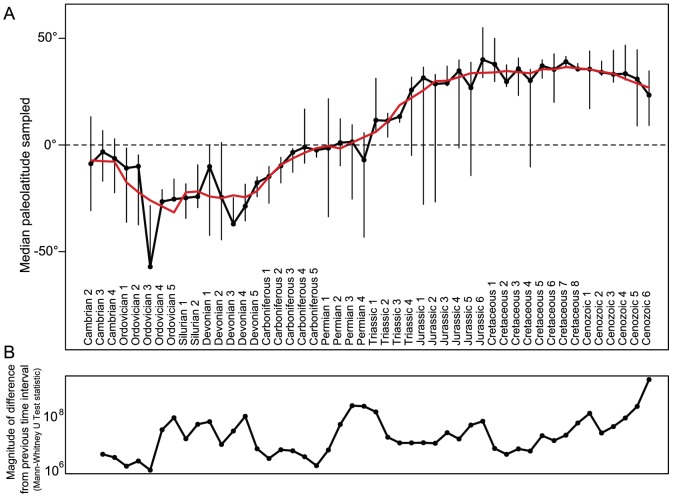
Figure 3. Spatial shifts in fossil occurrences through the Phanerozoic.
A) The median latitude of fossil occurrences steadily rises through the Phanerozoic, but is punctuated by short-term noise and contractions and expansions of geographic coverage. Error bars indicate 25th and 75th quantiles, while the red line is a moving average across five points. B) The Mann-Whitney U test statistic plotted for each interval. A higher test-statistic corresponds to a more severe change in latitude. All transitions are statistically significant but vary in their effect size.

