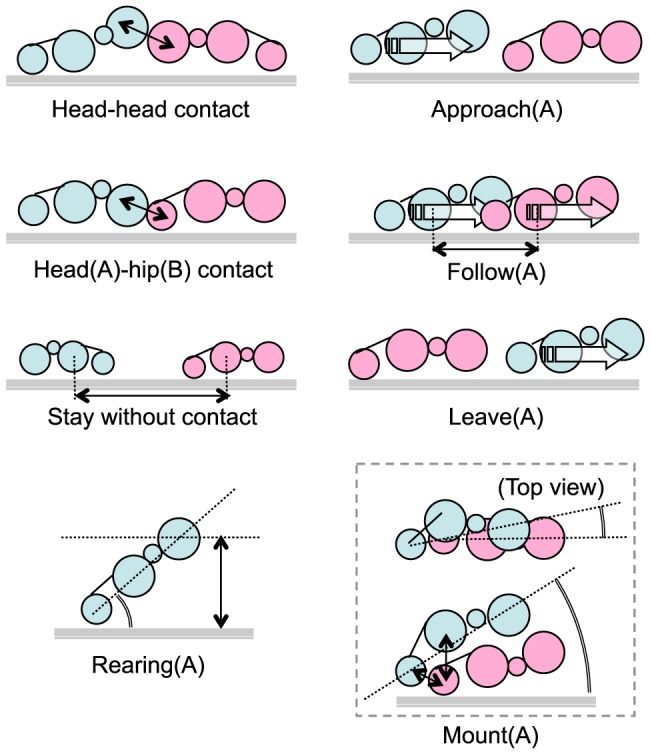
Figure 7. Definition of the behavioral events.

Gray line indicates the floor. The light blue model represents Rat A and the pink model represents Rat B. See text for details.

Gray line indicates the floor. The light blue model represents Rat A and the pink model represents Rat B. See text for details.