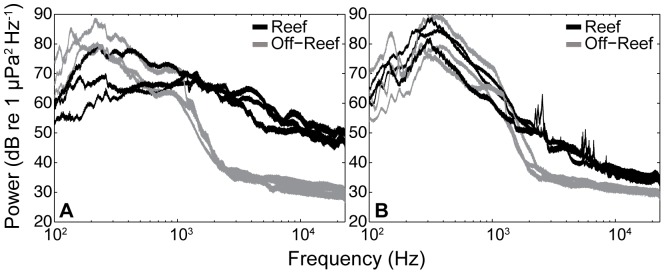
Figure 4. Oyster reef and off-reef acoustic spectra for two Pamlico Sound sites.

Power spectral density for sounds recorded on and off-reefs taken monthly July-September at (a) West Bay and (b) Crab Hole. Because the field recordings differed in total length, each multi-hour recording was shortened to a one-hour sample that began at sunset.This produced six pairs of recordings collected simultaneously in each habitat type. The displayed data represent the median spectra for each hour-long sample calculated from a series of non-overlapping 10-sec duration windows.
