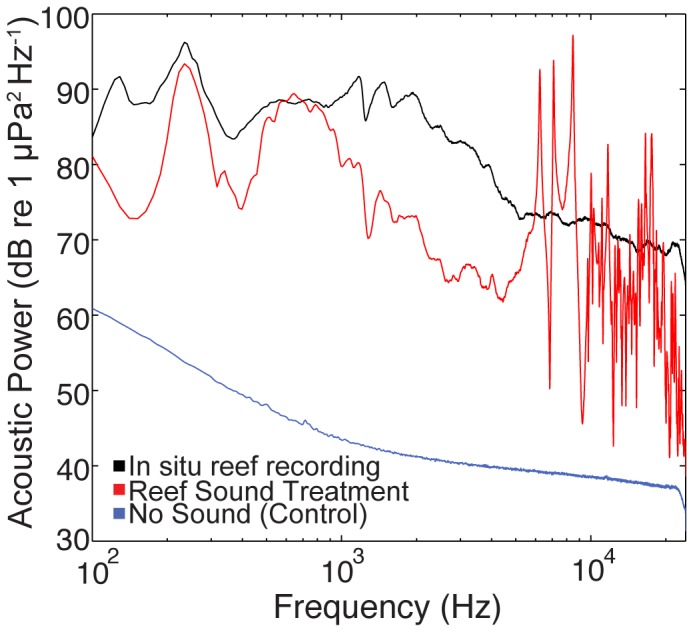
Figure 5. Spectral composition of sound in experiment 1 tanks (reef sound and no sound (control) treatments).

The black line represents the spectrum of the original in situ recording from West Bay oyster reserve that was replayed in reef sound tanks. Power spectral density estimated via Welch's method (Hamming window, 1-sec averages with 50% overlap).
